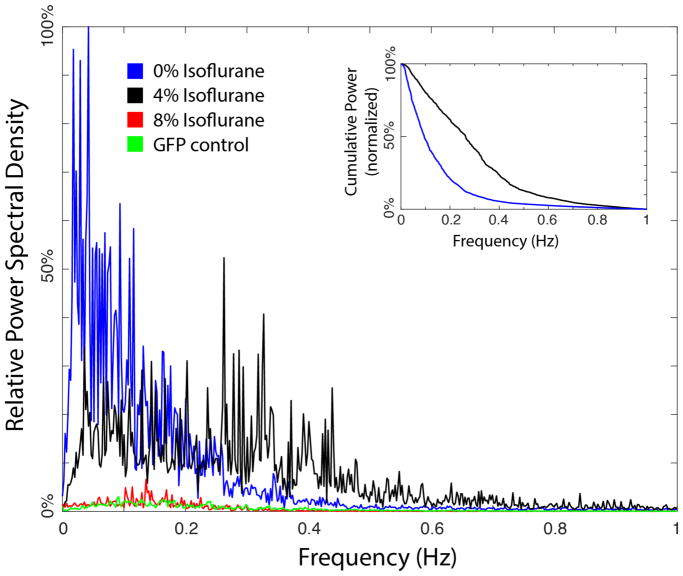
Figure 5. Mean power spectra of neuronal dynamics at varying levels of anesthesia.
Mean power spectra were measured across all neurons imaged at 0%vol, 4%vol, 8%vol isoflurane. In addition, measurements from animals expressing GFP in the imaged neurons are displayed as controls. Insert: The cumulative normalized power spectra measured at 0%vol and 4%vol isoflurane.

