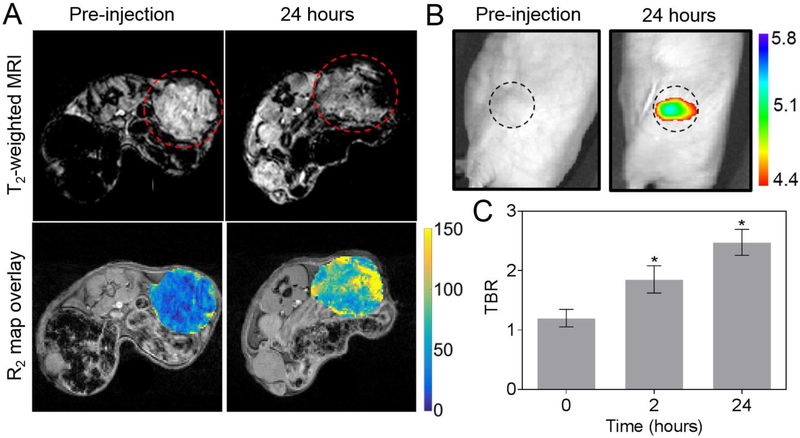
Figure 6.
In vivo MRI and NIRF optical imaging with AION. (A) Top: MR images of representative tumor-bearing mice pre-injection and at 24 hours post-injection with AION. Images are shown with TE of 13.2 ms. Red dashed circles indicate tumors. Bottom: representative R2 maps of the same mouse tumor before and after injection of AION. Scale bar in units of Hz (1/s). (B) NIRF images of representative tumor-bearing mice with AION at different time points. Black dashed circles indicate tumors. Scale bar in units of radiant efficiency (x109 (p/s/cm2/sr)/μW/cm2). (C) Tumor-to-background ratio calculated from the NIRF images with AION. Error bars are standard error of mean. * P < 0.05 compared to pre-injection scan (paired Student’s t-test).

