
Extended Data Figure 9.
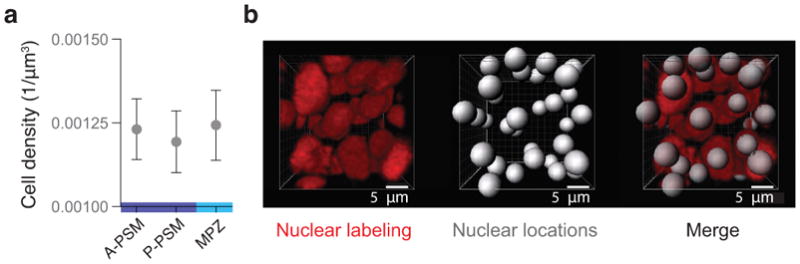
Cell density is uniform along the AP axis. a, Measured cell number density (cells per unit volume) in the MPZ, P-PSM and A-PSM. Mean ± SEM. Cell density does not vary significantly along the AP axis (within the 10% accuracy of our 3D measurements; Methods). b, 3D reconstructions of confocal stacks showing nuclei labeled with H2B::RFP, detected nuclei positions, and composition of both. Cell density was measured using 3D data of nuclear positions in the different regions (n = 7866, 7214, 11537 detected cells in 694, 694, 833 defined boxes in 5, 5, 6 embryos, respectively; Methods).