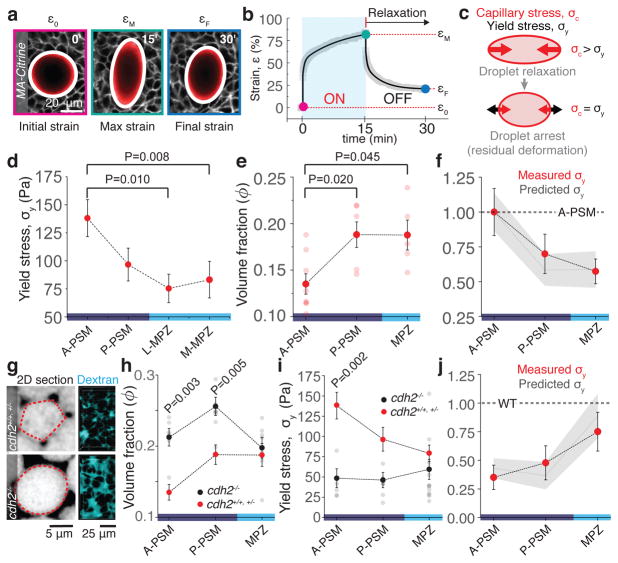
Figure 2. Mechanical integrity of the extending body axis.
a, Example of droplet dynamics during magnetic actuation. White lines indicate ellipse segmentation. Droplet actuation is characterized by an initial deformation or strain, ε0, a maximal strain, εM, and a final residual strain, εF (Methods). b, Temporal evolution of the droplet strain during magnetic actuation. Experimental data points (gray) and fit (black line) are shown (Methods). c, The residual droplet deformation is set by the balance between the capillary stress σc and the tissue yield stress σy. d–e, Measured yield stress (d; n=12, 12, 13, 13) and volume fraction of extracellular space ϕ (e; n=8, 6, 5) along the AP axis. Mean ± SEM; Mann-Whitney test. f, Comparison between measured (red dots) and predicted (gray line and band representing mean ± SEM) yield stress along the AP axis, relative to the A-PSM. g, Confocal sections (inverted) and 3D reconstructions (Methods) of Dextran-labeled extracellular space for WT (cdh2+/+, cdh2+/−) and cdh2−/− embryos. h–i, Measured volume fraction of extracellular space (h; n=6, 8, 7) and yield stress (i; n=5, 5, 12) along the AP axis in cdh2−/− embryos (black dots) compared to WT (red dots). Mean ± SEM; Mann-Whitney test. k, Measured (red dots) and predicted (gray line and band representing mean ± SEM) yield stress values in cdh2−/− embryos normalized to WT values in each region. In all cases, n represents number of embryos, given for each tissue region as shown in each panel.

