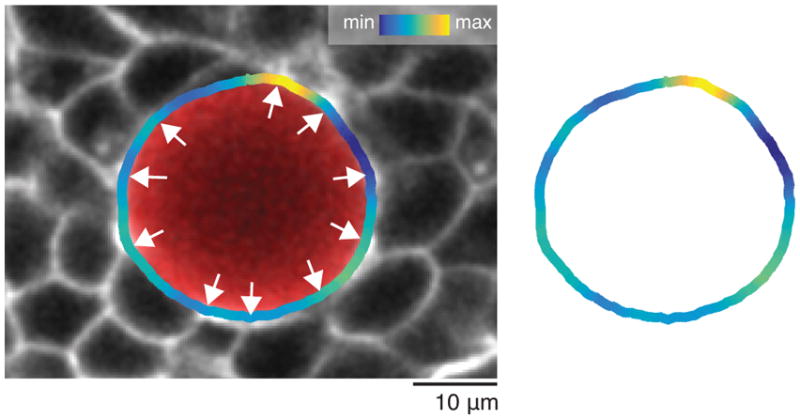
Extended Data Figure 2.

Curvature changes along the droplet contour correlate with the locations of cell-cell contacts surrounding the droplet. Confocal section of a ferrofluid droplet (red) in the MPZ of a Tg(actb2:MA-Citrine) embryo. The measured curvature values along the detected droplet contour are shown (color coded as in Fig. 1h) overlaid with the confocal image (left) and without it (right). White arrows point to locations of cell-cell contacts of cells surrounding the droplet, which correlate with maxima and minima of droplet curvature, consistent with the distance between maxima and minima being approximately the cell size (Fig. 1j).
