
Figure 1.
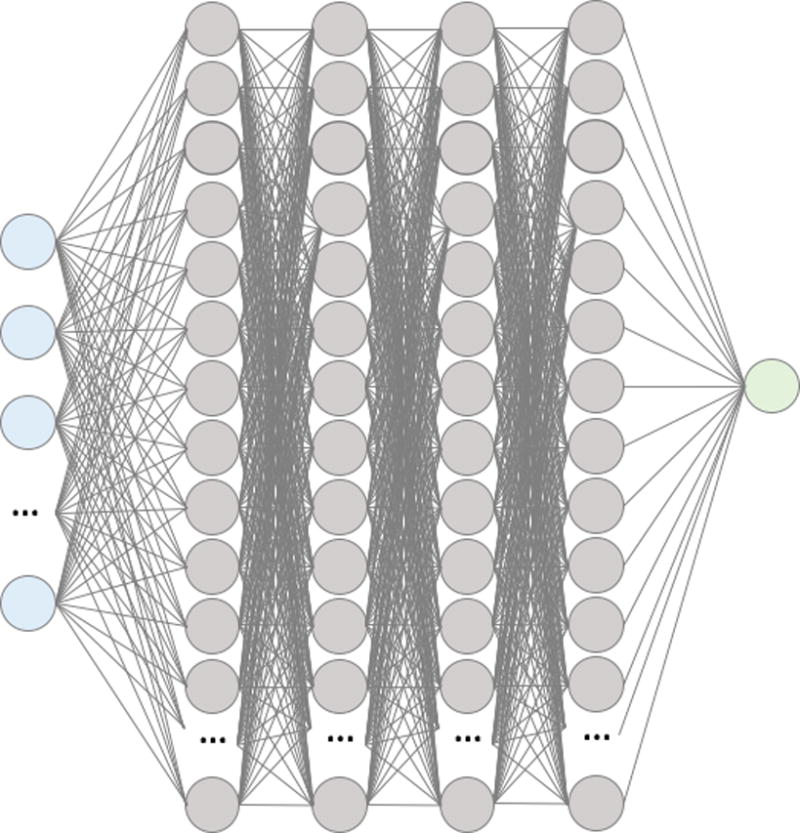
Summary visualization of the deep neural network. Input layer (blue) of features feed into the first hidden layer of 300 neurons with ReLU activations (grey). All the activations of neurons in the first hidden layer are fed into each of the neurons in the second, then all the of the second are fed into the third, and finally all of the third are fed into the fourth. All the activations of the neurons in the fourth hidden layer are then fed into a logistic output layer to produce a probability for in-hospital mortality between 0 and 1.