
Figure 3.
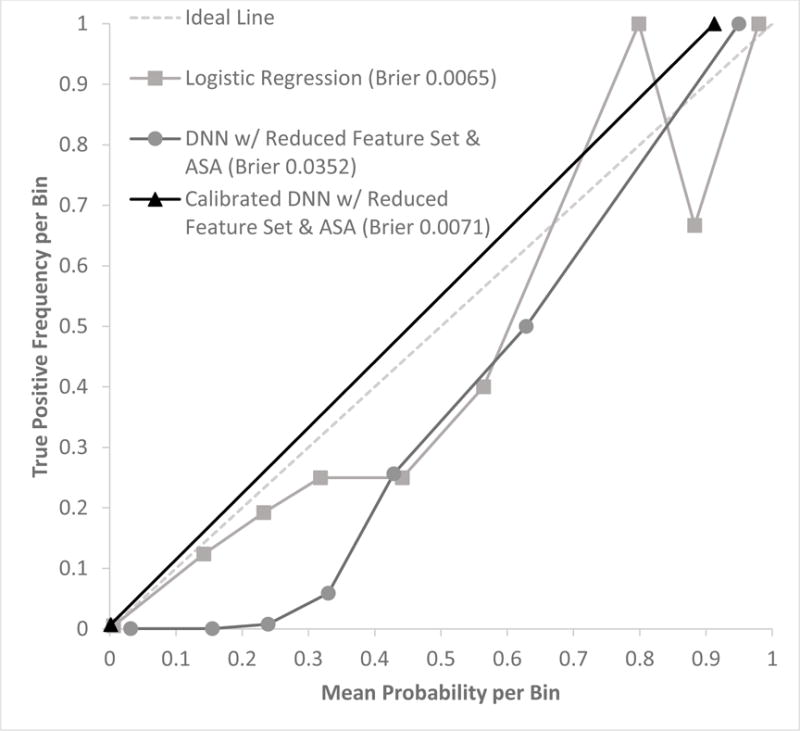
Calibration plot with mean predicted probability vs true positive frequency (# true positives/# samples) per probability value bins in the test data set (n = 11,997) for logistic regression, deep neural network (DNN) with reduced feature set and ASA, and calibrated DNN with reduced feature set and ASA. Bins of predicted probability were at intervals of 0.1: [0 to 0.1), [0.1 to 0.2), …, [0.9 to 1.0).