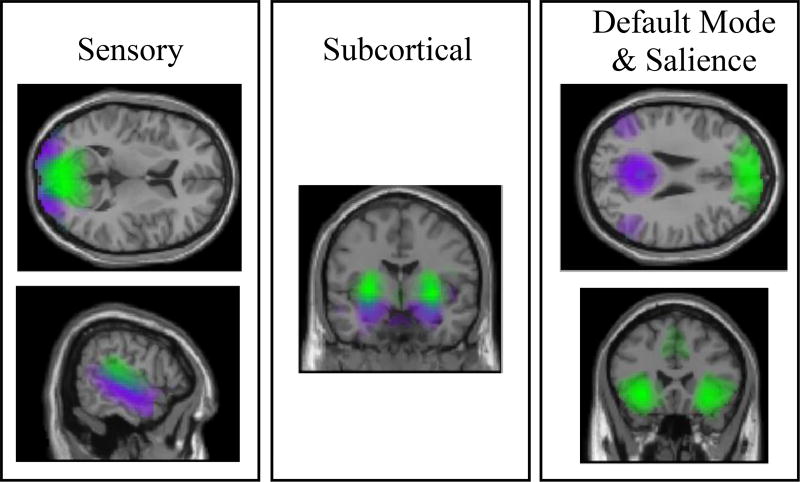
Figure 1. Networks.
Nine networks were selected based on their putative involvement in the generation of auditory and visual hallucinations. Different colors (green/purple) depict distinct resting-state networks. Top left: two visual networks; bottom left: two auditory networks; middle: subcortical networks (hippocampus in purple, putamen in green); top right: default mode network (anterior shown in green and posterior shown in purple); bottom right: salience network. All spatial maps were thresholded at Z > 3.

