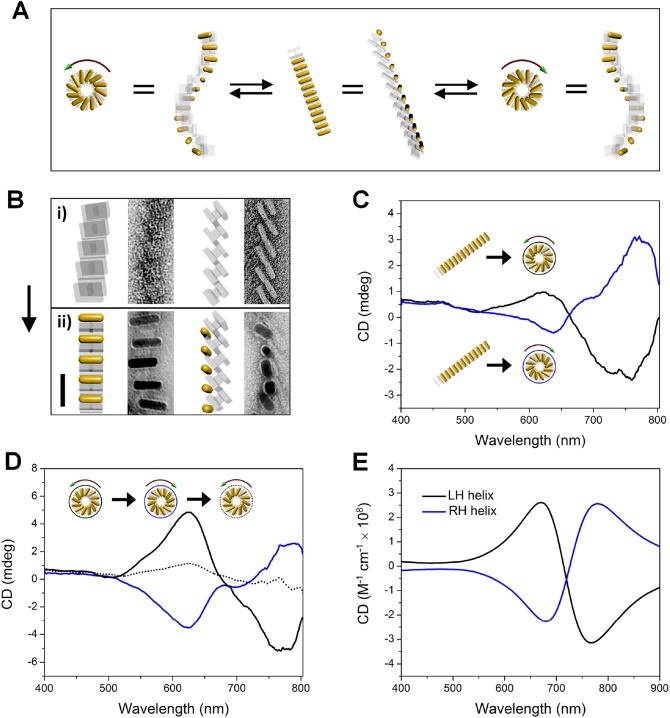
Figure 6.
Optical chirality inversion of AuNR superstructures. (A) Mechanistic illustration of the conversion of AuNR superstructures into two mirror-image states. (B) TEM images of the relaxed state of the DNA origami superstructures (i) and AuNR superstructures (ii), respectively. Different views of the superstructures are presented. The scale bar is 50 nm. (C) Experimentally measured CD spectra of the two mirror-imaged states converted from the relaxed state. (D) CD spectra for a full cycle of conversion between the left-handed and right-handed superstructures. The dotted spectrum shows a low recovery efficiency after a cycle of reconfigurations. (E) Theoretically calculated CD spectra of a left-handed and a right-handed superstructure. An interarm angle of 30° was used for the left-handed structure in the calculation, and 51° for the right-handed structure. These parameters were obtained from analyzing the TEM images of the DNA origami template for each superstructure (images similar to those shown in Figure 5B).

