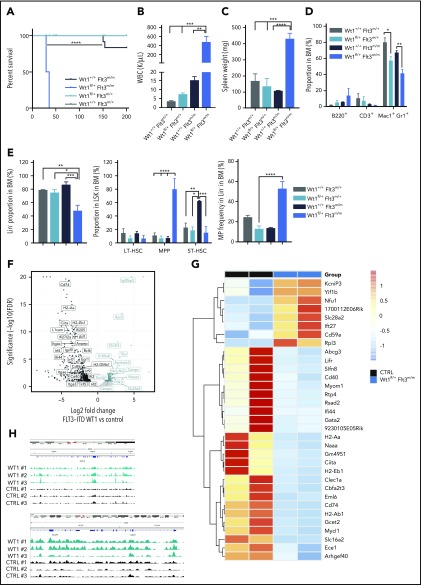
Figure 6.
Wt1 loss cooperates with Flt3-ITD mutations to induce leukemogenesis in vivo. (A) Kaplan-Meier survival curves for Wt1fl/+ Flt3m/m animals compared with Wt1+/+ Flt3m/m, Wt1fl/+ Flt3m/+, and Wt1+/+ Flt3m/+ animals (n = 15-20). WBC (K/µL) (B) counts and SPL weights (C) for primary Wt1fl/+ Flt3m/m mice at the time of euthanasia compared with littermates (n = 7). Proportion of mature (D) and stem/progenitors (E) cells in the BM compartment of primary Wt1+/+ Flt3m/+, Wt1fl/+ Flt3m/+, Wt1+/+ Flt3m/m, and Wt1fl/+ Flt3m/m mice at disease onset (n = 7). (F) Volcano plot with the log2 fold changes in gene expression in MPs isolated from Wt1fl/+ Flt3m/m mice compared with Wt1+/+ Flt3m/m (CTRL) mice on the x-axis and the statistical significance (−log10 P value) on the y-axis. (G) Heat map of overlapping genes from RNA-seq expression data set from MP cells isolated from Wt1fl/+ mice from the young chronic cohort compared with the data set from Wt1fl/+ Flt3m/m MP cells. (H) CHIP-seq signals for Wt1 at Ciita and CD74 loci. Data are mean ± standard error of the mean (B-E). *P < .05, **P < .01, ***P < .001, ****P < .001, Mantel-Cox test (A) or 2-way analysis of variance (B-E).

