. 2018 Aug 3;9(36):7236–7240. doi: 10.1039/c8sc02984a

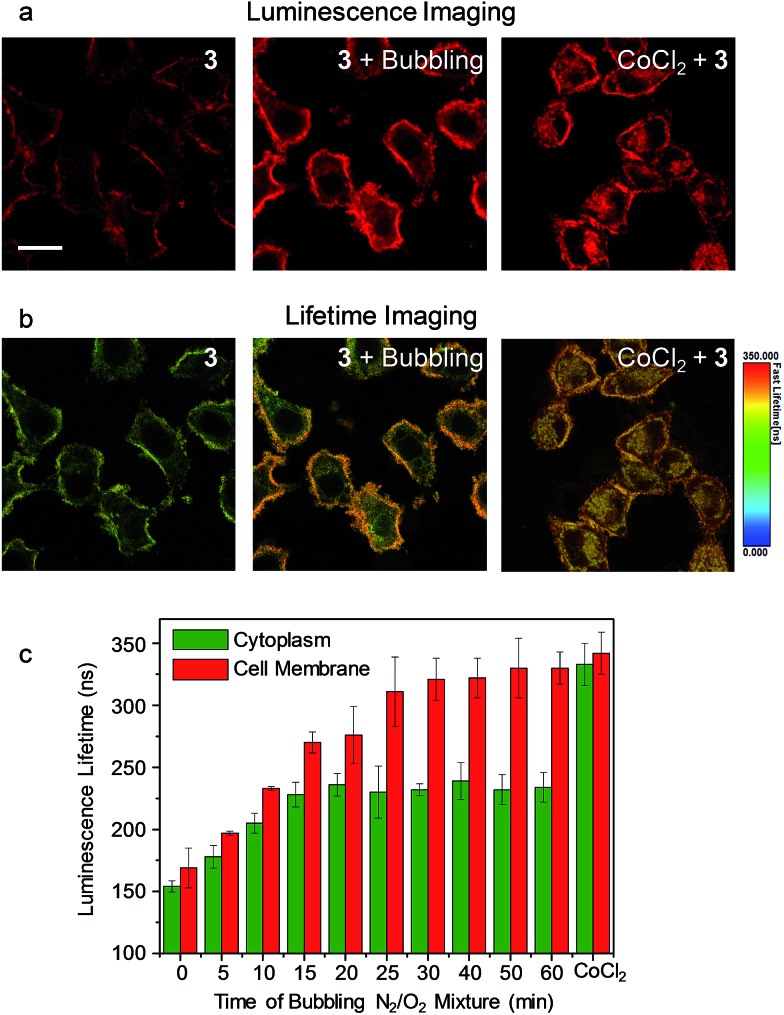
Fig. 4. (a) Laser-scanning luminescence confocal microscopy and (b) photoluminescence lifetime imaging microscopy images of living HeLa cells incubated with complex 3 (5 μM, 20 min, 37 °C) before and after bubbling a gas mixture of 5% O2 and 95% N2 into the culture medium for 60 min and the cells pretreated with CoCl2 (100 μM, 2 h, 37 °C) and incubated with complex 3 (5 μM, 20 min, 37 °C). Scale bar: 20 μm. (c) Bar chart showing the luminescence lifetime values in the cytoplasm (green) and the cell membrane (red) of the HeLa cells incubated with complex 3 (5 μM, 20 min, 37 °C) during the bubbling gas mixture and after CoCl2 pretreatment. The error bars represent the standard deviations of ten lifetime values randomly obtained from independent cells.

Fig. 4