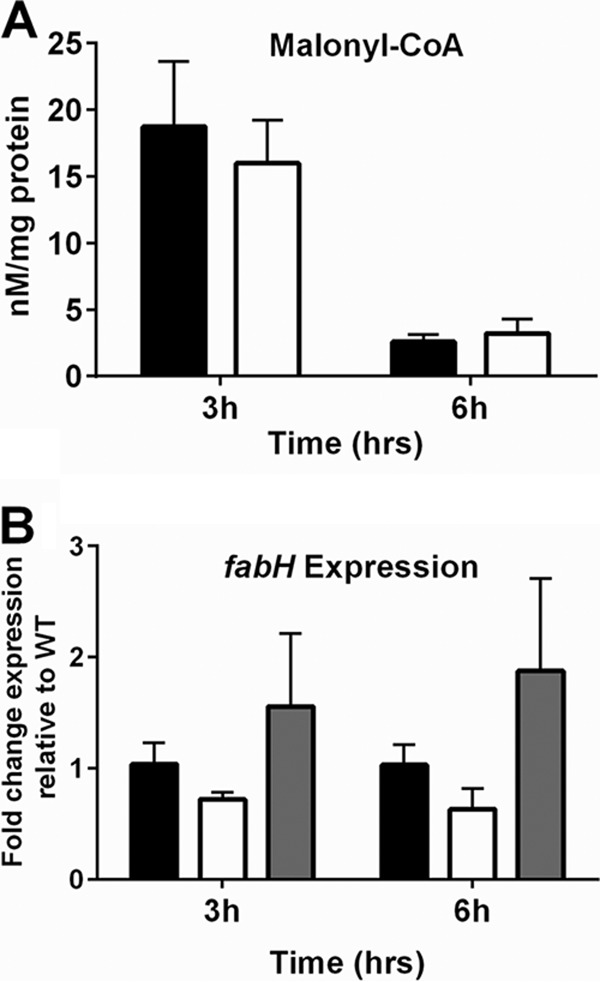
FIG 4.

(A) Quantification of intracellular levels of malonyl-CoA after 3 and 6 h of growth for wild-type (black bars) and fakA mutant (white bars) strains. Data are averages (n = 4) with standard deviations and are normalized to protein concentration. *, P < 0.05. (B) fabH transcript levels at 3 and 6 h of growth in wild-type (black bars), fakA mutant (white bars), and fakA complement (gray bars) strains. Data are average (n = 3) fold changes relative to wild-type, with standard errors of the mean.
