FIG 8.

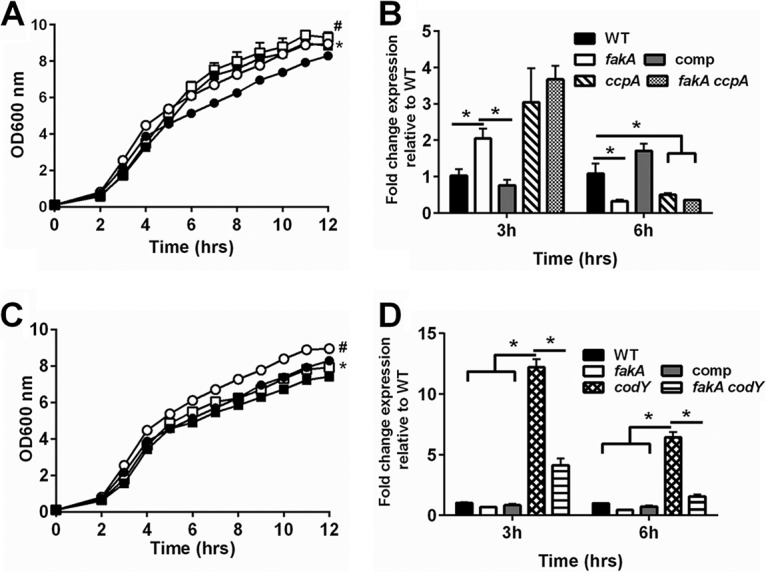
(A) Growth of wild-type (closed circle), fakA mutant (open circle), ccpA mutant (closed square), and fakA ccpA mutant (open square) strains. All data points are the averages (n = 3) with standard deviations from representative experiments. An asterisk indicates a significant difference (P < 0.05) between the WT and ccpA mutant for all time points except 5 h, and # indicates significant difference between the fakA and fakA ccpA mutants at hours 2 to 4 and 11 only. (B) Transcript levels of gltA determined via quantitative real-time PCR (qRT-PCR) after 3 or 6 h of growth. Data are the average (n = 3) fold changes relative to the wild type (wild type = 1) with standard errors of the mean. An asterisk denotes a significant difference (t test, P < 0.05). (C) Growth of wild-type (closed circle), fakA mutant (open circle), codY mutant (closed square), and fakA codY mutant (open square) strains. Data are the averages (n = 3) with standard deviations from representative experiments. An asterisk indicates significance (P < 0.05) between WT and codY mutant at hours 2, 3, 9, 10, and 12 only, while # identifies difference between the fakA and fakA codY mutants at all time points. (D) Transcript levels of ilvD determined via qRT-PCR at 3 or 6 h of growth. Data are the average (n = 3) fold changes relative to the wild type (wild type = 1) with standard errors of the mean. An asterisk denotes a significant difference (t test, P < 0.05).
