
Figure 1. Bone marrow cell tagging.
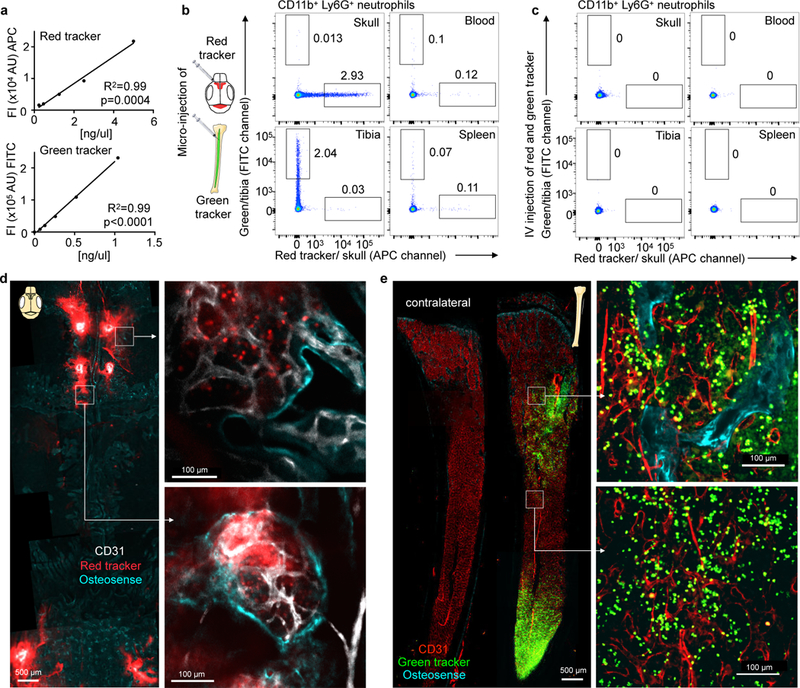
a, Concentration dependent fluorescence intensity of in vitro labeled bone marrow cells by flow cytometry for the red (APC, n=5 mice) and green (FITC, n=6 mice) cell tracker in 2 different experiments. b,c, Representative flow cytometry from naive mice 24 hrs after (b) marrow microinjection of red and green cell tracker or (c) intravenous injection (independently repeated twice with same results). d,e, Confocal imaging of (d) calvarium and (e) tibia after microinjection of red and green cell tracker into 2 different mice (single experiment). Bone outline is visualized with osteosense (turquoise) and endothelium with CD31 in vivo immunolabeling.