
Figure 2. Neutrophil tracking in stroke, carrageenan-induced meningoencephalitis and myocardial infarction.
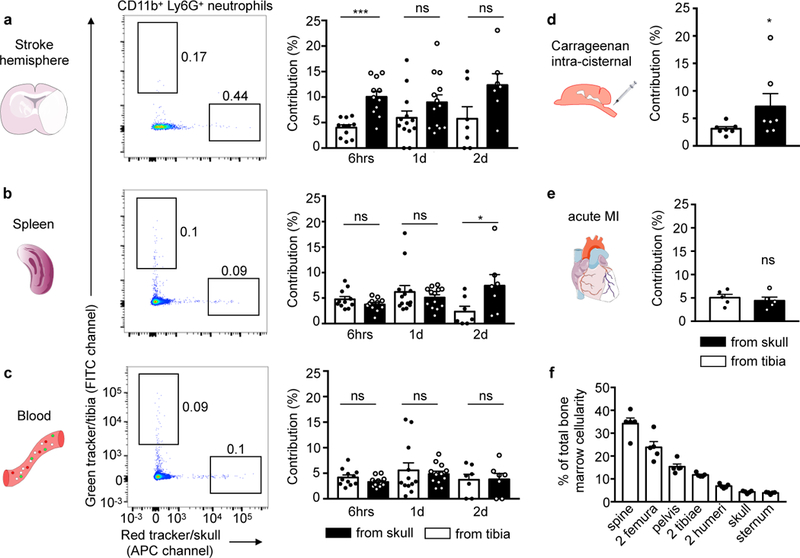
a-c, Representative examples of neutrophil tracking after tagging in skull (red) and one tibia (green tracker) in the same animal, 6 hrs (n=11, 5 experiments), 1 day (n=13 for brain and spleen, n=12 for blood, 5 experiments) and 2 days after stroke induced by permanent occlusion (n=7, 2 experiments). Contribution was normalized to cell frequency at injection site. Two-tailed paired Wilcoxon test; brain, 6hrs, ***P=0.002, 1d, P=0.127, and 2d, P=0.219; spleen, 6hrs, P= 0.206, 1d, P=0.787 and 2d *P=0.016; blood, 6hrs, P=0.153, 1d, P=0.97 and 2d, P=0.812. d, Neutrophil exit from the skull and the tibia in aseptic meningoencephalitis (n=7, 4 experiments, two-tailed paired Wilcoxon test, *P=0.031) and (e) after myocardial infarction (n= 5, 1 experiment, two-tailed Wilcoxon test, P=0.813). f, Size of bone marrow compartments, n=5 mice. Data are mean ± s.e.m. See also Supplementary Fig. 2 for gating and Supplementary Fig. 3 for related analyses.