
Figure 8. Channels in the mouse (a-f) and human skull (g-l) imaged by microCT.
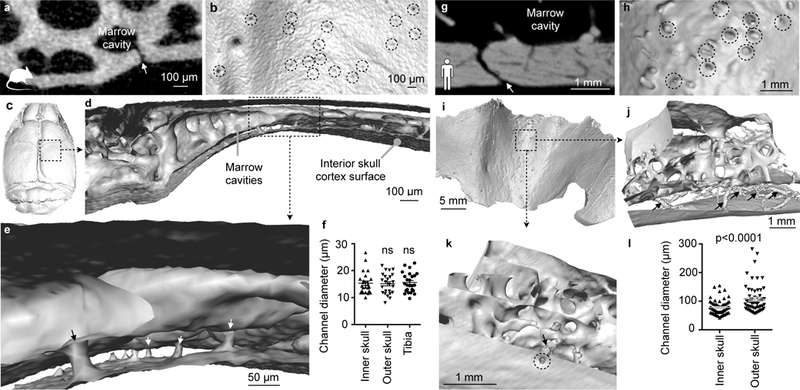
a,g, Coronal view of channel (arrow) in a mouse (a) and human (g). b,h, Interior skull surface reconstruction, channel openings indicated by dashed circles. c,i, Interior skull surface reconstruction. d,e,j,k, Coronal surface rendering of channels (arrows). f, Channel diameter according to location in mouse and (l) in human. Each point is one channel. Data were obtained in 1 mouse (inner and outer skull, n= 24; tibia, n=25), one-way Anova P= 0.96 and 3 humans (inner and outer skull, n=60), two-tailed t-test with Welch’s correction, p<0.0001 . Data are mean ± s.e.m. See Supplementary movie 6.