Fig. 3.

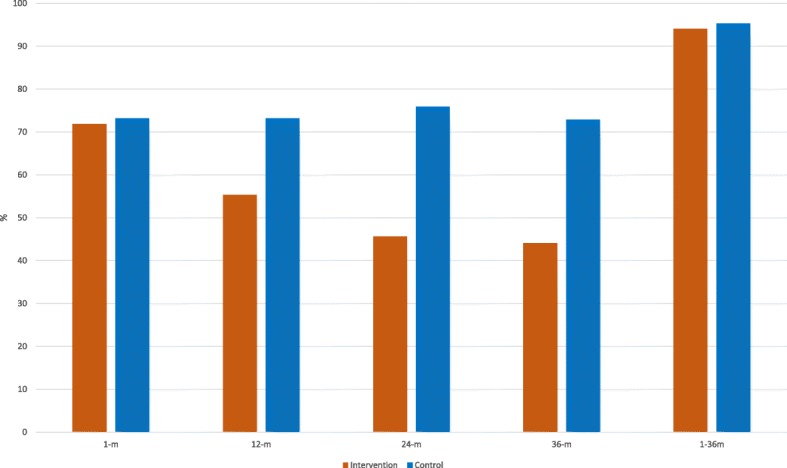
Proportion of participants with at least one SBP, DBP, or LDL-C measurement above the treatment target at 1, 12, 24 and 36 months follow up and during the entire study period. m months

Proportion of participants with at least one SBP, DBP, or LDL-C measurement above the treatment target at 1, 12, 24 and 36 months follow up and during the entire study period. m months