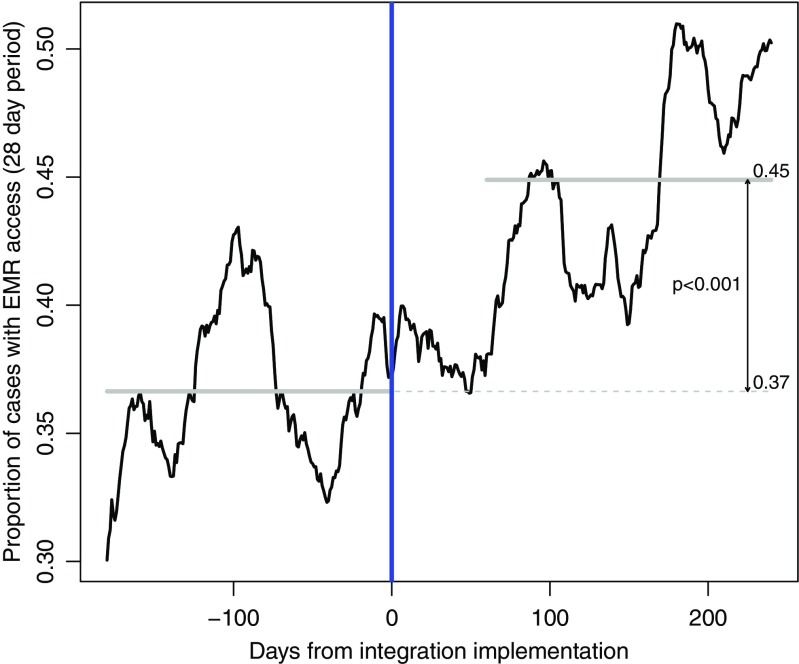
Fig. 1.
Proportion of exams for which the radiologist accessed additional clinical information from the EMR, before and after implementation of context integration. Plot represents proportions for overlapping 28-day periods; gray lines represent overall proportions for pre- and post-integration periods

