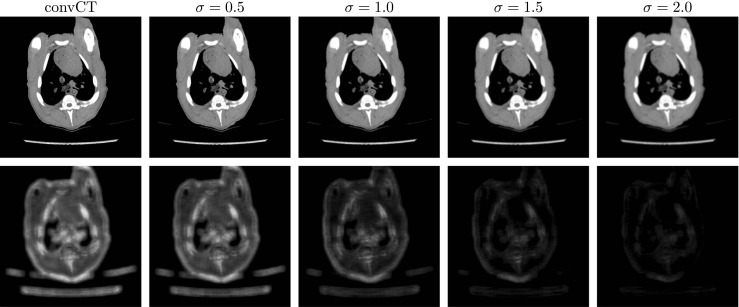
Fig. 3.

The output of the sharpness detection network. The upper row is the convCT of a lung region selected from the piglet dataset and its blurred versions with increasing amount of Gaussian blur (σ shown on top). The lower row shows their corresponding sharpness map
