Figure 1.

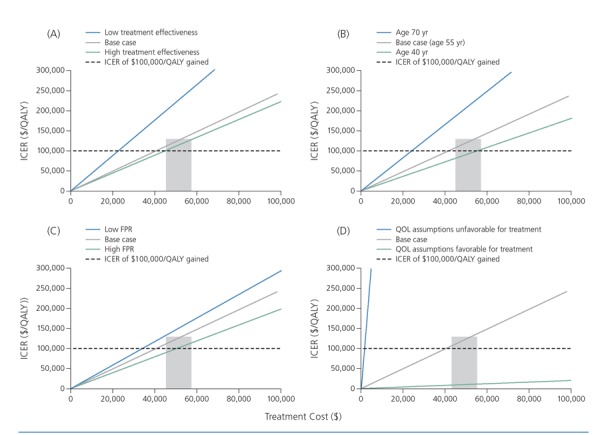
Incremental cost-effectiveness ratios (ICERs) for hepatitis C therapy in early stage disease according to treatment effectiveness (A), age (B), fibrosis progression rate (FPR) (C), and quality of life (QOL) (D). The y axis in each graph is the ICER for treating an individual with early stage disease compared with waiting for later-stage disease. The dashed black line indicates an ICER of $100,000 per quality-adjusted life-year (QALY) gained, posited as a reasonable cost-effectiveness threshold. The grey boxes represent a range of prices that most payers are paying for a new hepatitis C regimen. The solid grey lines in each graph represent a base-case assumption about the 4 parameters shown. The base case generally intersects $100,000 per QALY gained within or near the grey box, indicating that treatment is cost-effective at current prices in base cases of early disease. However, the assumptions regarding QOL include a nearly vertical line, representing almost no effect of early disease. Adapted from Leidner et al.6
