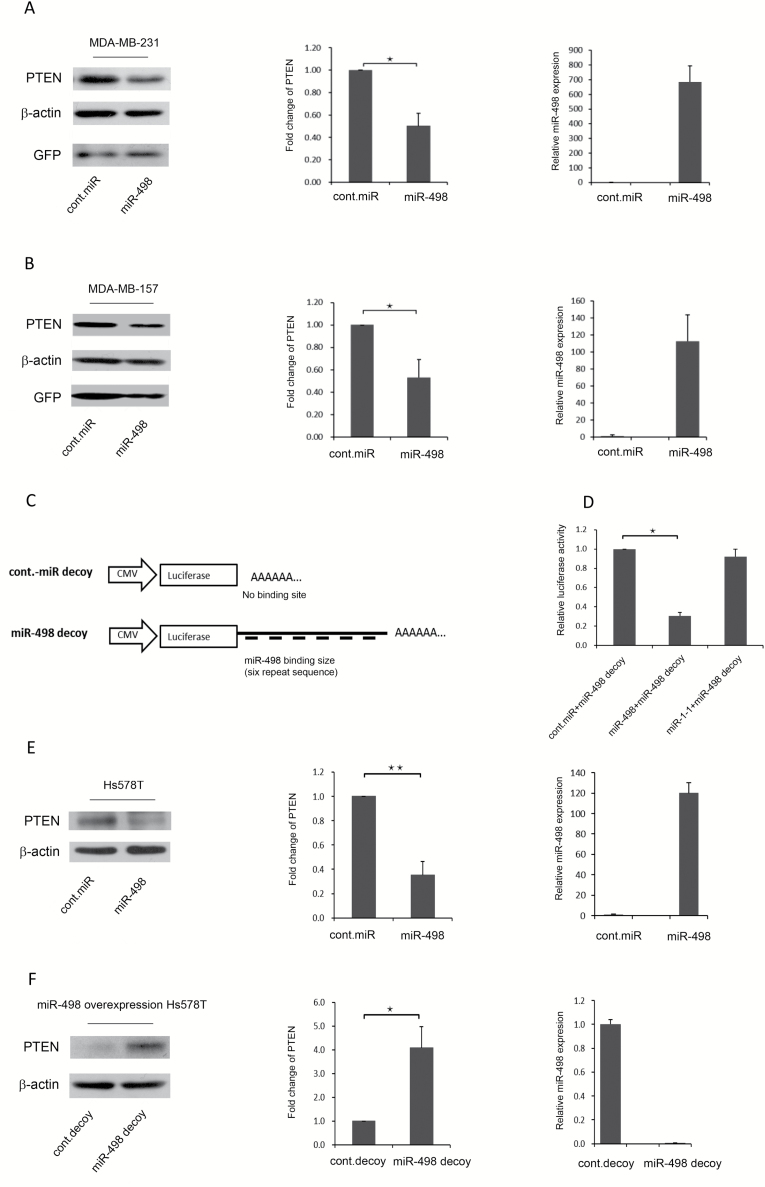
Figure 2.
miR-498 negatively regulates PTEN protein levels in TNBC cell lines. (A) MDA-MB-231 cells were transduced with a retrovirus encoding control-miRNA or miR-498 as indicated. Levels of PTEN were detected by western blotting. GFP was used as a marker for retroviral transduction efficiency (left panel). Densitometry was performed with ImageJ software (NIH), and relative PTEN band intensities were normalized to β-actin. Relative fold changes in PTEN levels induced by miR-498 are shown (middle panel). miR-498 expression levels were measured by qRT-PCR (right panel). (B) Similar to A, except that MDA-MB-157 cells were used. (C) Structure of the miR-498 decoy. (D) miR-498 bound exclusively to the miR-498 decoy and suppressed target luciferase translation. (E) Hs578T cells were transfected with the miR-498 expression plasmid, and miR-498-overexpressing Hs578T cells were selected by hygromycin for 3 weeks. PTEN protein levels were detected by immunoblotting (left panel). Densitometry was performed with ImageJ software and relative PTEN band intensity was normalized to β-actin. The corresponding graph is a schematic of a densitometry analysis of a western blot (middle). Levels of miR-498 expression were measured by TaqMan qRT-PCR (right panel). (F) The miR-498 decoy was transduced into miR-498-overexpressing Hs578T cells. Endogenous miR-498 expression and PTEN protein levels were measured by immunoblotting (left panel). The fold change in PTEN protein levels was compared with the control decoy and the miR-498 decoy (middle). Levels of miR-498 expression were detected by qRT-PCR in the indicated cells (right panel). Error bars indicate the SD, *P < 0.01, ** P < 0.001 (n = 3); results are from three independent experiments.

