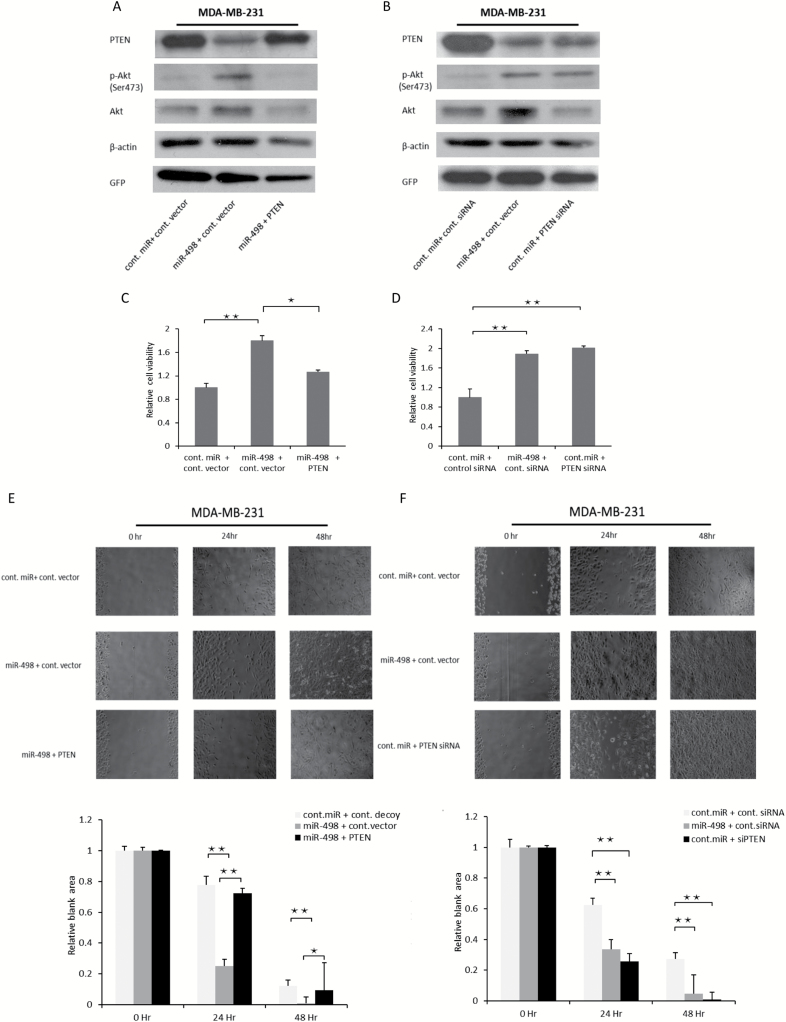
Figure 5.
Introduction of PTEN rescues miR-498-overexpression-induced phenotypes. (A) MDA-MB-231 cells were transfected with the miR-498 and PTEN ORF or control vector and analyzed by immunoblotting with indicated antibodies. (B) Similar to A, except that plasmids expressing miR-498 and PTEN-siRNA or control-siRNA were co-transfected into MDA-MB-231 cells. (C) MDA-MB-231 cells were transfected with the indicated expression plasmids and seeded on 96 well plates and the value of OD 550 nm was measured and normalized to the value of the control group after 48 h. (D) Similar to C, the indicated expression plasmids were transfected into MDA-MB-231 cells, and cell viability was examined by the MTT assay. Error bars indicated the SD, *P < 0.05, **P < 0.01 (n = 3) and results were the mean value of three independent experiments. (E) MDA-MB-231 cells were trypsinized and counted 2 days after transfection with the indicated plasmids. The scratch assay was carried out in a 24-well plate. The wound areas were tracked continuously for 48 h on the stage of a phase-contrast/fluorescence microscope (Zeiss Axiovert 100M) coupled to a charge-coupled device camera. The data were analyzed with Metamorph software (Molecular Devices); phase-contrast images of three to five selected fields were acquired at 24 and 48 h. Quantitative analyses of the open wound areas were measured using the ImageJ MRI Wound Healing Tool. The relative blank areas of the scratches were measured to evaluate cell migration, and statistical analyses of the cell migration are shown in the lower panel as indicated. (F) Similar to E, except that MDA-MB-231 cells were transfected with the different expression plasmids as indicated. Error bars indicated the SD, *P < 0.01, **P < 0.001 (n = 3) and results were the mean value of three independent experiments.

