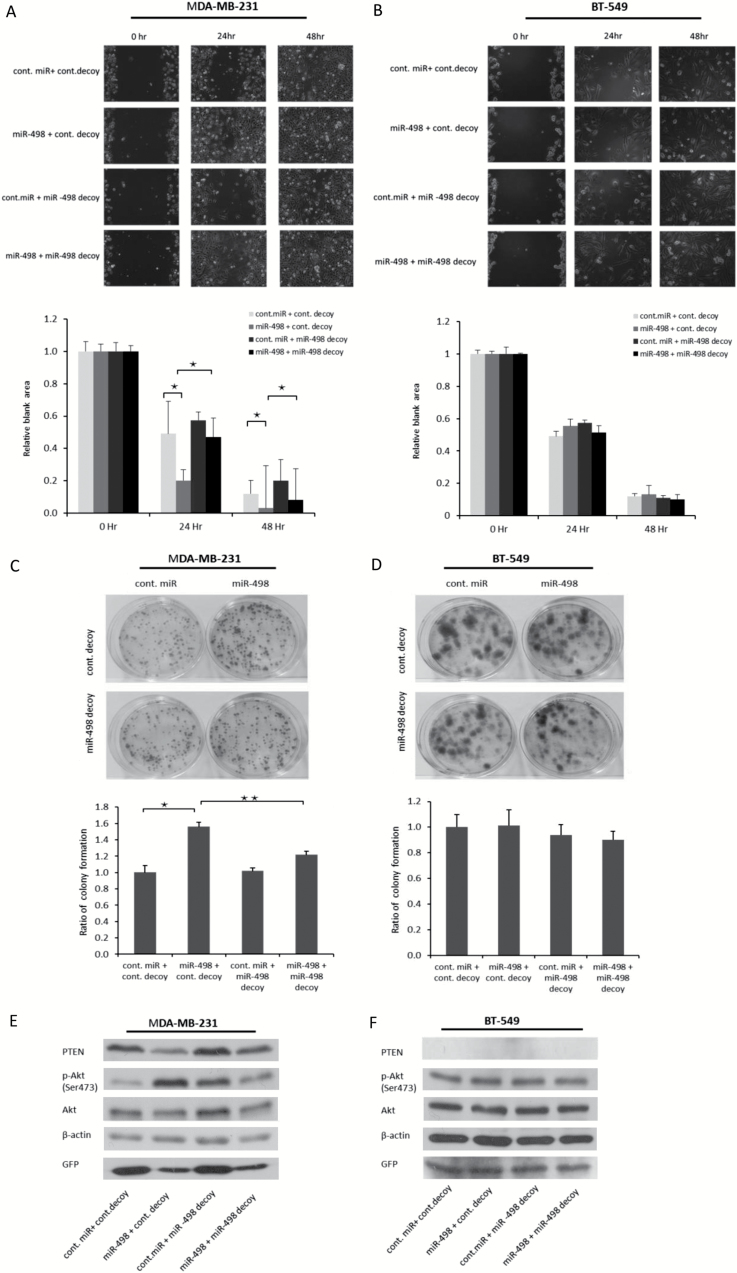
Figure 6.
The oncogenic effect of miR-498 overexpression was inhibited by the miR-498 decoy. (A) MDA-MB-231 and (B) BT-549 cells were trypsinized and counted 2 days after transfection with indicated plasmids. The scratch assay was carried out as described in Figure 5E. The relative blank areas of the scratches were measured to evaluate cell migration, and statistical analyses of the cell migration are shown in the lower panel of A and B. *P < 0.05. (C). MDA-MB-231 cells were transfected with the indicated expression plasmids. Colony-forming assays were performed. Ratio of colony formation is shown in the lower panel as indicated. All experiments were performed in triplicate. *P < 0.05. **P < 0.01. (D) Similar to C, except that BT-549 cells were used. (E and F) miR-498 and the miR-498 decoy were transduced into MDA-MB-231 (E) and BT-549 (F) cells. The levels of PTEN and p-Akt were determined by immunoblotting as indicated. *P < 0.01 (n = 3).

