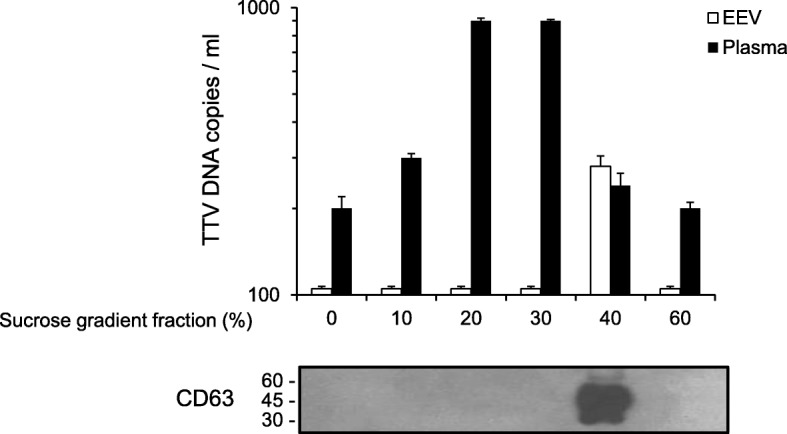
Fig. 3.

TTV load and WB of EEVs after sucrose gradient separation. TTV loads in selected plasma fraction (Plasma) and EEVs (Exosomes enriched vesicles) after sucrose gradient centrifugation are reported. The presence of CD63 positivity as EEVs representative marker in indicated sucrose gradient fraction is also indicated. The values shown are the means ± standard deviations
