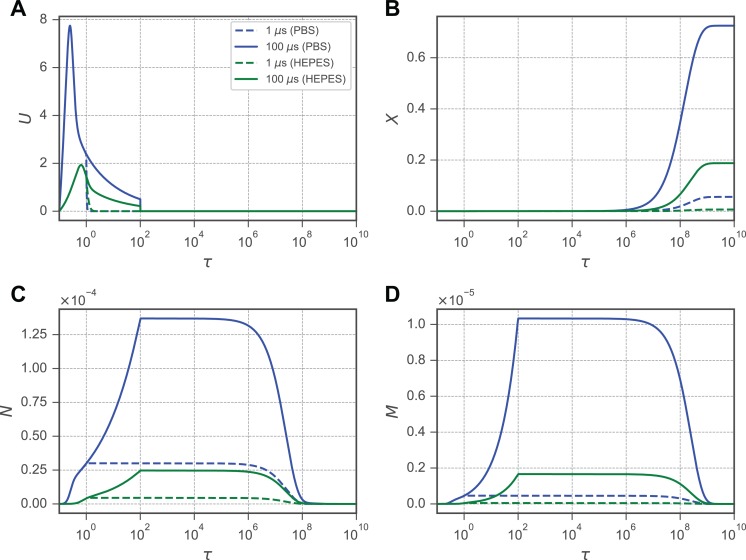
Figure 3.
Evolution of membrane porosities N and M and the resultant molecular uptake X following an increase in the normalized transmembrane potential U. In each plot, solid lines indicate an applied electric field microseconds, and dashed lines indicate microseconds. Blue lines indicate a phosphate buffered saline buffer solution, and green lines indicate a 4-(2-hydroxyethyl)-1-piperazineethanesulfonic acid buffer. A, The TMP U, driven by a large external electric field, reaches an initial maximum until the membrane begins to shunt ionic currents as N and M increase. B, The intracellular concentration of solute X increases as it enters the cell through the membrane porosity stage. C, An intact membrane enters a stage conductive of small ions N driven by a TMP. D, M develops from N, dependent on U, and allows larger molecules to pass through the cell membrane. For all simulations, kV/m.

