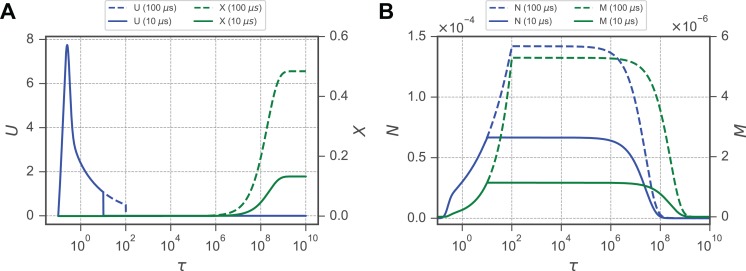
Figure 4.
The transmembrane potential and molecular uptake occur on dramatically different timescales. A, Pulses with durations of 10 and 100 microseconds are shown simulated using . B, A lag exists between when the N stage is fully relaxed to 0 as the M stage persists. M and N reach plateaus upon removal of the source current with the applied electric field of kV/m.

