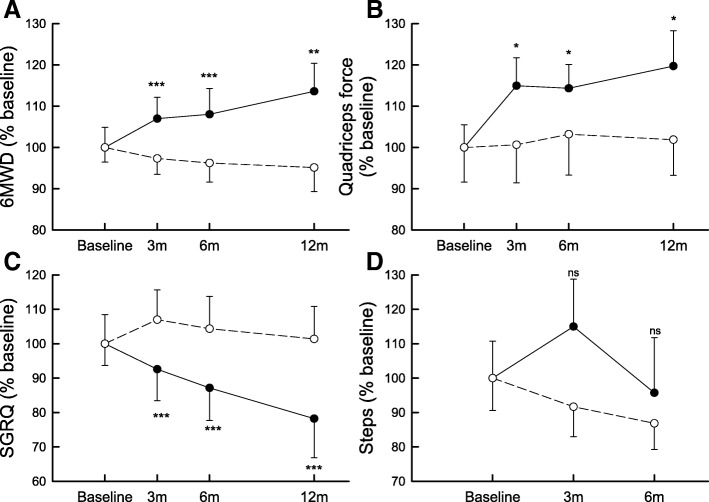
Fig. 2.
Effects of PR and at 1-year on exercise capacity, muscle force, health status, physical activity. 6-min walking distance (6MWD) (Panel a), quadriceps force (Panel b), St-Georges respiratory questionnaire (SGRQ) (Panel c) and steps per day (Steps) (Panel d) expressed as percentage (%) of the baseline value as a function of time. Closed circles (solid lines) and open circles (dashed lines) are the mean values and SEM at each time points of rehabilitation and control groups, respectively. Rehabilitation and control groups were compared for rehabilitation effects at each time points: *** p < 0.001; ** p < 0.01; * p ≤ 0.05; ns p > 0.05

