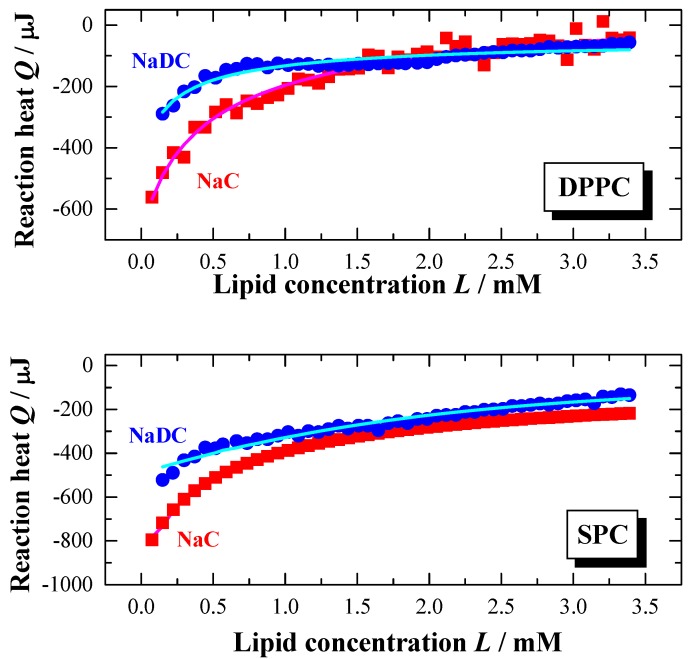
Figure 6.
Partition experiment: Titration of a lipid dispersion (syringe) of a concentration of 20 mM, DPPC (top) and SPC (bottom), into a NaC (10 mM) or NaDC (4 mM) solutions in water at T = 60 °C (pH 7.5). Injection scenario: 50 injections à 5 μl. The plots represent the change in reaction heat Q of each injection versus lipid concentration L in the cell (adapted from [56,59]). The full lines were obtained from simulations using the partition model described in the text.

