Fig. 5.
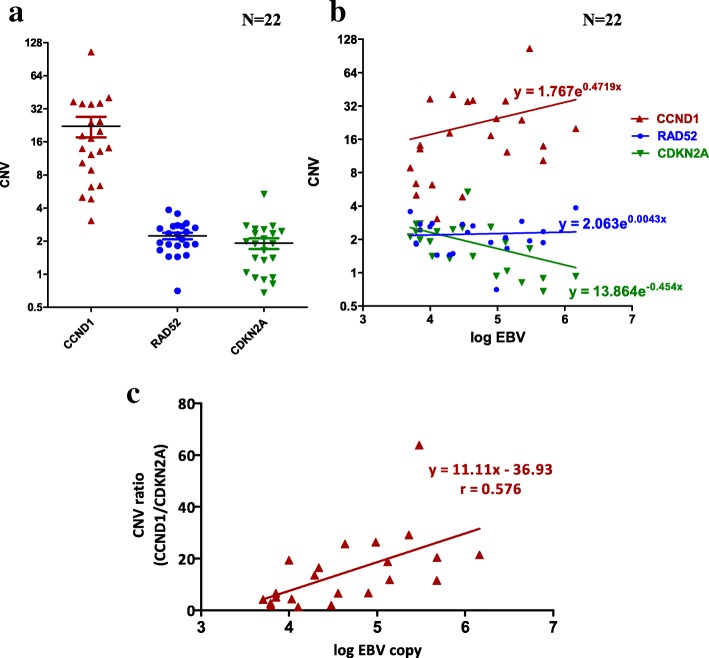
Correlation of CNV of CCND1, CDKN2A and RAD52 with high EBV copy number in 22 NPC plasma. (a) CNV of CCND1, CDKN2A and RAD52 in 22 NPC plasma with high EBV DNA load (> 5000 copies/ml) based on Q-PCR results. (b) Correlation plot between CNV of CCND1, CDKN2A and RAD52 and log EBV DNA load in 22 NPC plasma samples (c) Correlation between CNV of the CCND1/CDKN2A ratio and log EBV load in 22 NPC plasma. Pearson’s correlation coefficient, r, and equations of regression are indicated

