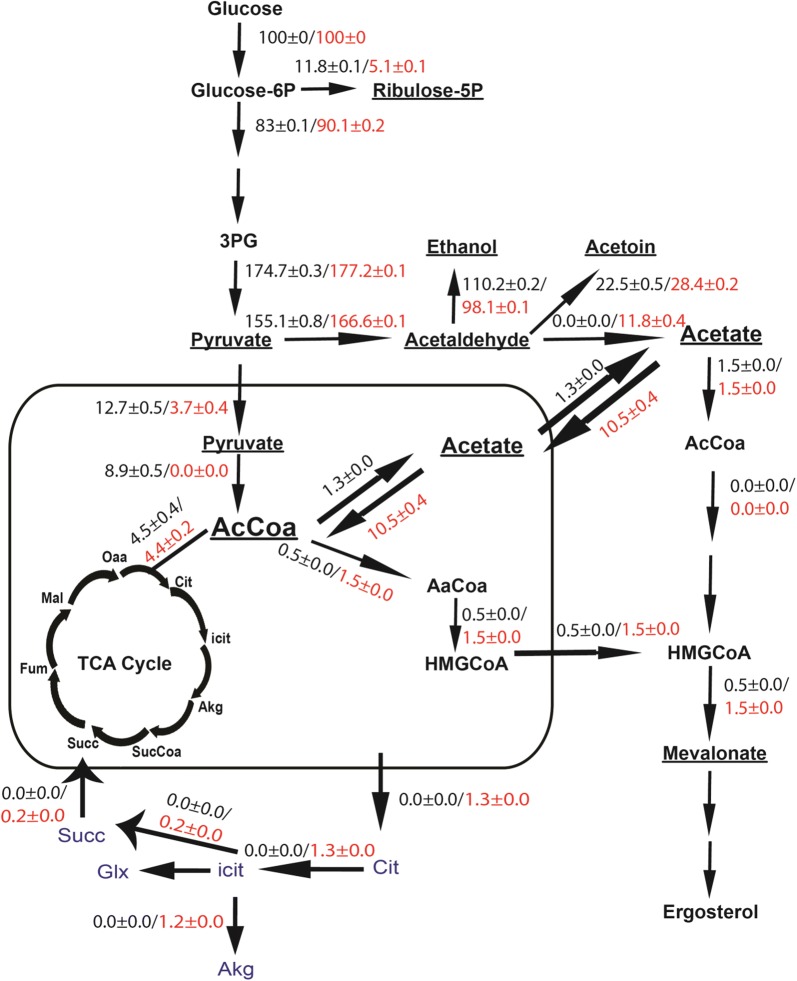
Fig. 1.
Flux distribution in central metabolism of control 101a (SPT15WT) and mutant 102a (spt15_Ala101Thr) strain without transcriptomic changes. Fluxes are simulated with iMM904 model using experimentally determined constraints for S. cerevisiae strain carrying either SPT15WT plasmid (Control 101a strain) or spt15_Ala101Thr plasmid (mutant 102a strain). Fluxes in wild type and mutant are shown in black and red colours. The metabolites showing major changes are underlined. Glyoxylate cycle which is present only in mutant strain is shown in blue colour

