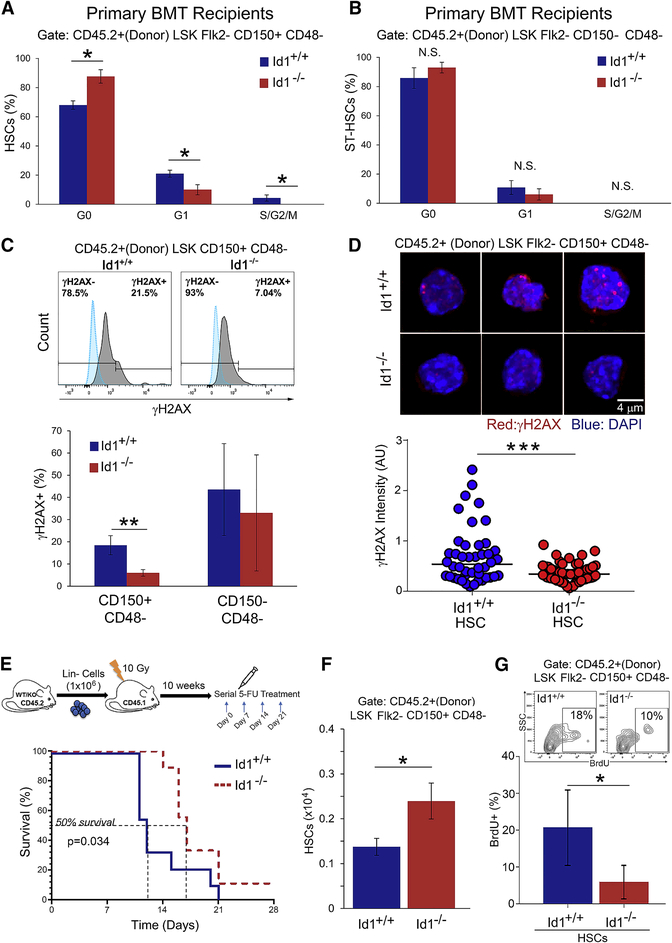
Figure 2. Increased quiescence of Id1−/− HSCs after bone marrow transplantation.
(A-B) Quantitation of Id1−/− and Id1+/+ HSC cycling in primary recipient mice by Ki-67/FxCycle analysis. (n=5 mice/group). (C) Quantitation of γH2AX phosphorylation expression levels of Id1−/− and Id1+/+ HSC in primary BMT recipient mice by flow cytometry ( n=5 mice/group). (D) Immunoflourescence analysis of γ-H2AX foci in Id1−/− and Id1+/+ HSCs FACS sorted from primary BMT recipient mice by confocal microscopy. Mann-Witney test p<0.00086, and z-score −3.33. (E) Kaplan-Meier survival curves of chimeric Id1+/+ and Id1−/− recipient mice treated with 5-FU. Mantel-Cox test P=0.034 (n=10 mice/group). (F) Quanitification of HSCs in chimeric Id1+/+ and Id1−/− BMT recipient mice treated with 5-FU (n=5 mice/group). (G) Quantification of HSC proliferation in Id1−/− and Id1+/+ chimeric mic after 5-FU-induced proliferative stress by BrdU incorporation assay (n=5 mice/group). See also Figure S3/S4.

