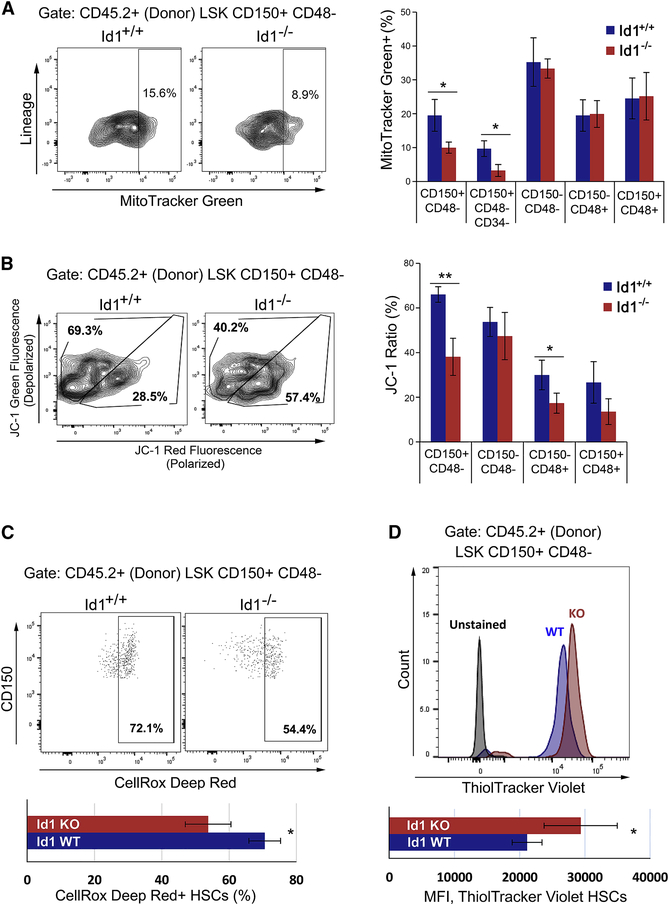
Figure 3. Reduced mitochondrial stress and ROS production in Id1−/− HSCs after bone marrow transplantation.
(A) Quantification of mitochondrial biogenesis in Id1−/− and Id1+/+ HSPCs from secondary BMT recipients using MitoTracker Green and flow cytometry(n=5 mice/group). (B) Quantification of mitochondrial stress in Id1−/− and Id1+/+ HSCs from secondary BMT recipients using JC-1 to measure mitochondrial membrane depolarization. (Percentage JC-1 ratios = % FITC/(% FITC + % PE) x100) (n=5 mice/group). (C) ROS expression levels in Id1−/− and Id1+/+ HSCs from secondary BMT recipients using CellRox Deep Red (n=5 mice/group). (D) Quantification of intracellular reduced thiols in Id1−/− and Id1+/+ HSCs from secondary BMT recipients using ThiolTraker Violet (n=5 mice/group). See also Figure S5.

