Figure 1.
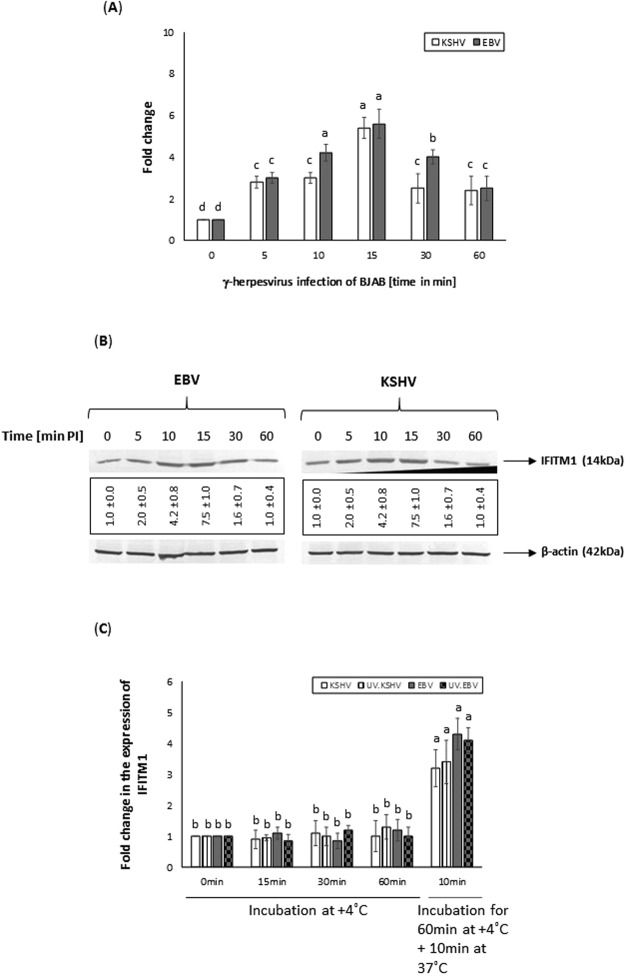
Infection of BJAB cells with EBV and KSHV induce expression of IFITM1. (A) The relative expression of IFITM1 in EBV or KSHV infected BJAB cell was monitored by qRT-PCR. The expression was measured in terms of cycle threshold value (Ct) and normalized to expression of β-actin. The x-axis denotes the time point post virus infection in minutes and the y-axis denotes fold change in expression of IFITM1. (B) Western blotting analysis demonstrates EBV or KSHV infection of BJAB cells to increase IFITM1 protein levels. Expression of IFITM1 levels was normalized to β-actin protein levels. Data representing the IFITM1 protein expression levels are presented as fold increase (average ± s.d. from three experiments) in the boxes below the panels. (C) Virus binding to cells is not sufficient to induce IFITM1 expression. BJAB cells were incubated with 10 MOI of wild-type and UV inactivated viruses for different time points at +4 °C or 60 min at +4 °C plus a 10 min incubation at 37 °C prior to monitoring expression of IFITM1 by qRT-PCR. Bars (A,C) represent average ± s.d. of five individual experiments. Columns with different alphabets indicate the values to be statistically significant (p < 0.05) by least significance difference (LSD). The Western blot results (B) presented are a representative data and the original full-length blots for EBV and KSHV of the cropped images is provided in Supplemental Figs 3 and 4, respectively.

