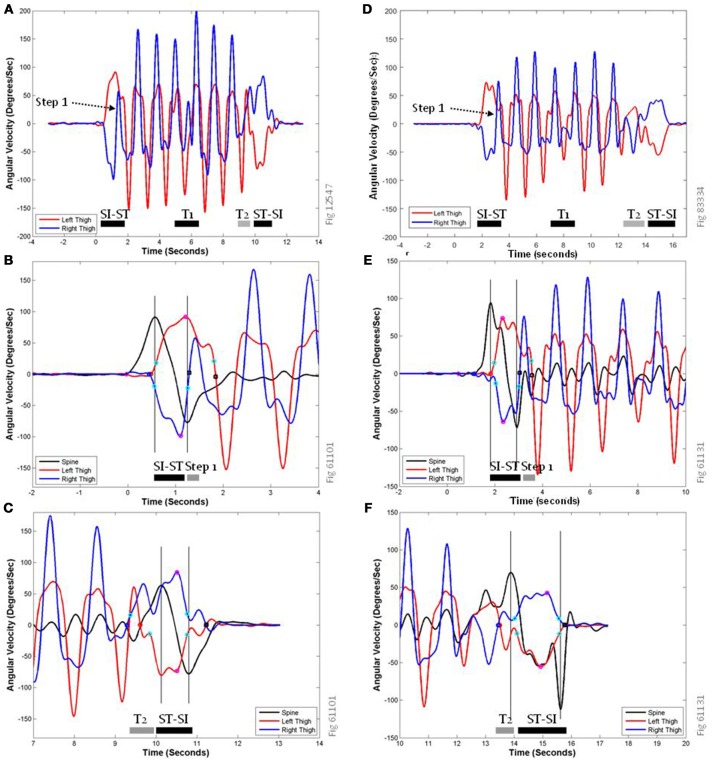
Figure 3.
Representative traces of pitch gyroscope sensors data during the TUG task. (A) shows the activity of the left (red) and right (dark blue) thigh sensors during the entire TUG task for a healthy volunteer. SI-ST, sit-to-stand transition; ST-SI, Stand-to-Sit transition; T1, Turn 1; T2, Turn 2; which elides directly into the ST-SI transition. (B,C) show expanded views of the same representative traces at the sit-to-stand transition (B) and the stand-to-sit transition (C), labeled with key points for feature calculation. (D–F) show analogous traces for a PwMS; note that the different panels have slightly different scales on their axes. In addition to the pitch traces from the left thigh (red) and the right thigh (dark blue), (B,C,E,F) include a pitch trace from the lumbar spine sensor (black), to allow comparisons with previously published data features based on torso-mounted sensor data. The peaks/troughs for the thigh traces are magenta circles, and the peaks/troughs for the spine are shown as vertical gray lines. The start of the rise for the left thigh is a red circle, for the right thigh is a dark blue circle, and for the spine is a magenta diamond. Step end points are shown as black squares, and 20% rise and 80% return points are shown as cyan circles.

