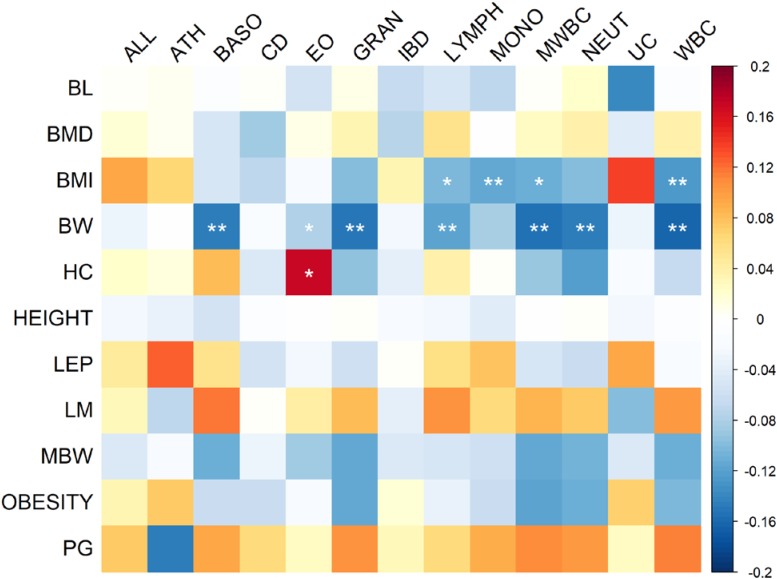
FIGURE 1.
Heat map of genetic correlation coefficients between immune and growth phenotypes. The P-values of correlation coefficients were corrected by FDR. Genetic correlations with FDR less than 0.05 are indicated by one star, whereas correlations with FDR less than 0.01 are indicated by two stars.

