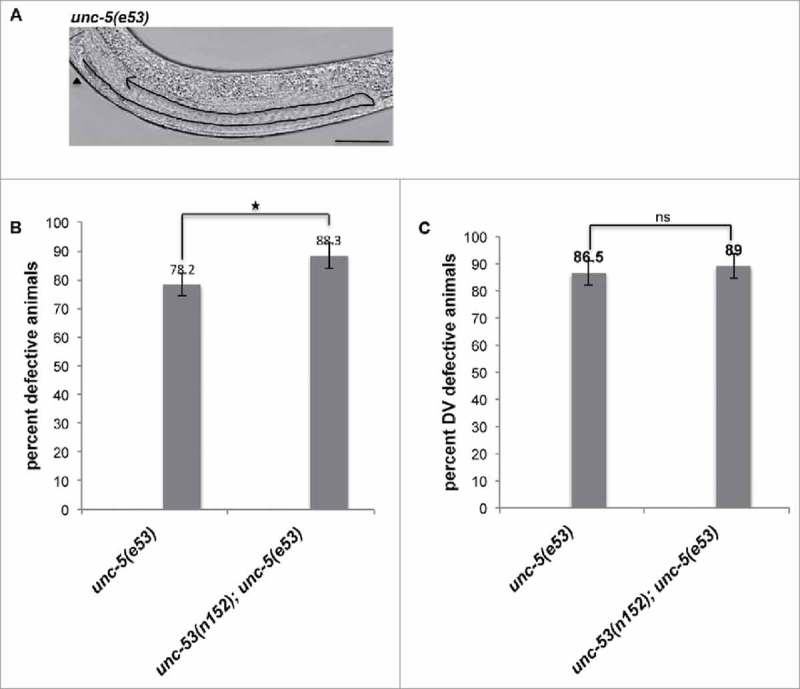
Figure 3.

(A) Representative DIC micrograph of unc-5(e53) L4 stage animals with anterior and midbody () on the left, displaying DTC phase 2 DV defect. Scale bar: 50 μm. (B) L4 stage animals were assessed for DTC migration defects using DIC microcopy as described in Materials and Methods. The bars represent percentage of animals with misshaped gonad arms. (C) The graph shows the percentage of animals exhibiting DTC phase 2 DV defects. Statistical analysis used TTEST. *p < 0.05, **p < 0.005, and ***p < 0.0005.
