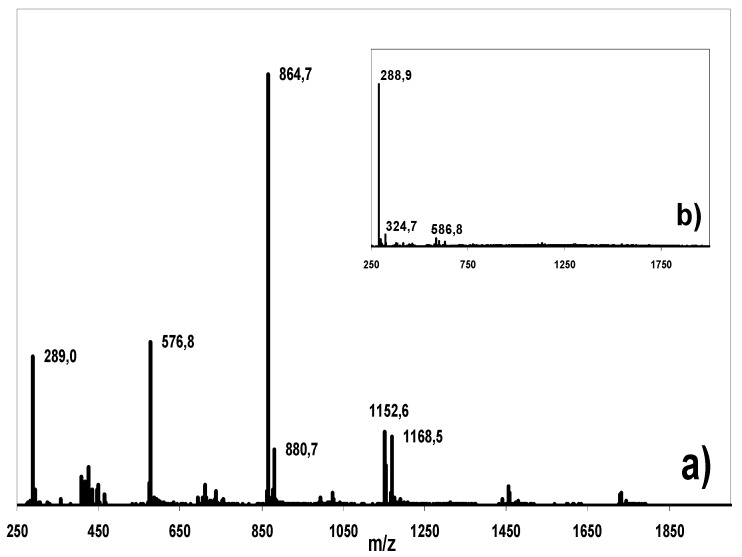
Figure 6.
MS spectra (averaged over the retention time frame of the flavan-3-ols, 20-35 min) of a) the raw cocoa bean extract and b) the isolated and purified flavan-3-ols from this extract. The signals in the extract spectrum correspond to procyanidins. The small signals in the isolated flavanols correspond to ionization-induced adducts and fragments and background noise.

