
Figure 3.
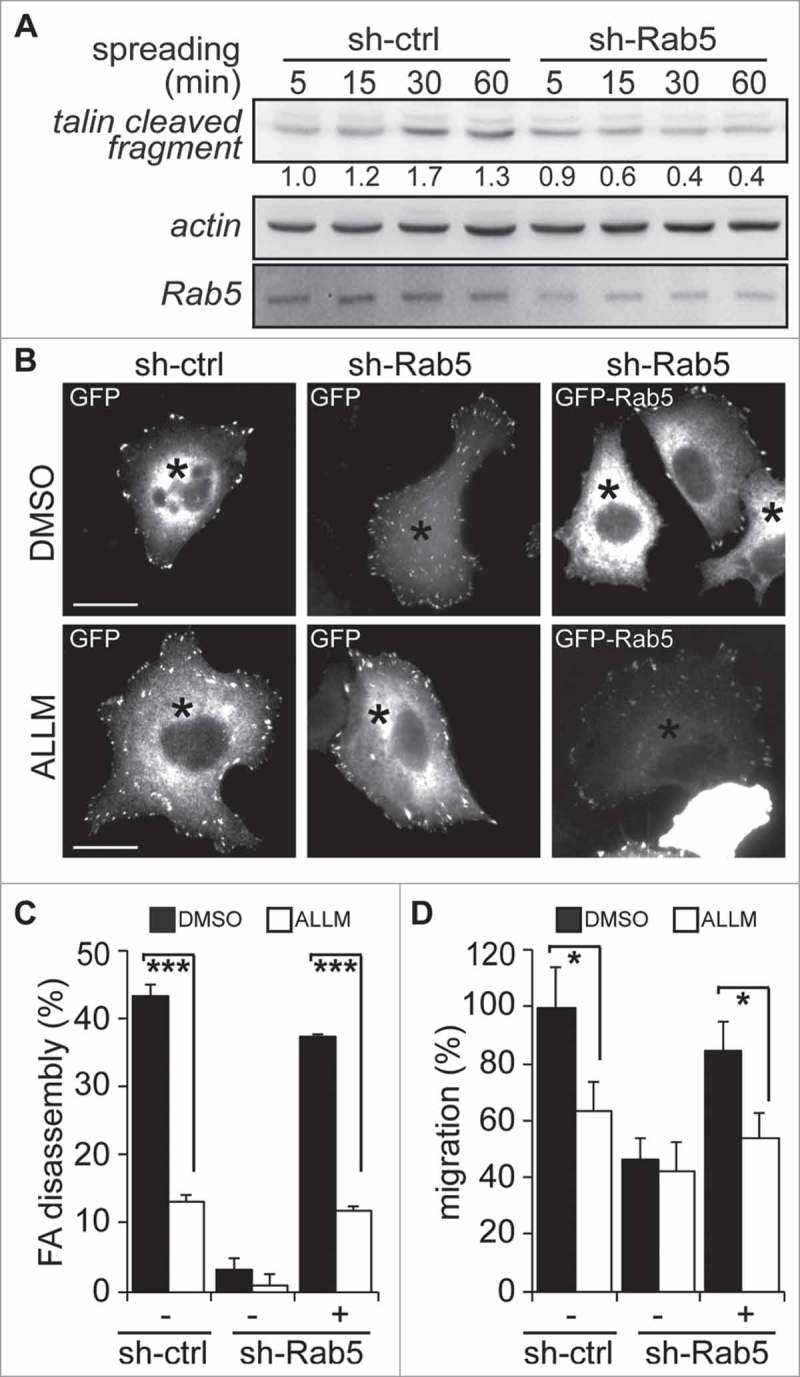
Rab5-mediated focal adhesion disassembly and cell migration require calpain2. (A) A549 cells treated with either shRNA-control (sh-ctrl) or shRNA-Rab5 (sh-Rab5) were allowed to attach and spread on fibronectin-coated plates (2 µg/mL) and whole cell lysates were analyzed by Western blotting of talin cleaved fragment (47 kDa), Rab5 and actin. Representative images are shown and numbers below the panel correspond to the quantification of talin signals by scanning densitometry. Data were normalized to actin (loading control) and shown as the mean of three independent experiments. (B) A549 cells treated with shRNA-control or shRNA-Rab5 were transfected with either GFP (−) or GFP-Rab5 (+), grown on glass coverslips and serum starved overnight. Focal adhesions were synchronized by treatment with 10 µM nocodazole, and focal adhesion disassembly was assessed upon 15 min of nocodazole washout in the presence of either control vehicle (DMSO) or the calpain inhibitor ALLM (50 μM). Focal adhesions were visualized by vinculin staining and representative images obtained after nocodazole washout are shown. Asterisks indicate GFP-positive cells (whole composite images are provided as Supplementary Figure 2). Bar represents 10µm. (C) Focal adhesion disassembly was quantified as the difference between the total number of synchronized focal adhesions per cell (time point 0) and residual focal adhesion number after nocodazole washout. Representative images (B) and data (C) were obtain from three independent experiments (mean ± s.e.m.; ***p<0.001). Note that at least 100 cells were analyzed per condition. (D) A549 cells treated with shRNA-control (sh-ctrl) or shRNA-Rab5 (sh-Rab5) were transfected with either GFP (−) or GFP-Rab5 (+) and allowed to migrate for 120 min in Transwell chambers coated with 2 μg/mL fibronectin in the presence of either control vehicle (DMSO) or the calpain inhibitor ALLM (50 μM). Cells that migrated were visualized by crystal violet staining. Data represent the average from three independent experiments (mean ± s.e.m; *p < 0.05).