Figure 1.

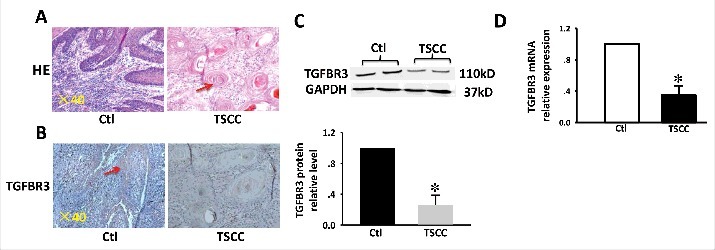
Expression of TGFBR3 in TSCC tissues. (A) H&E stain and IHC analysis. (B) TGFBR3 expression in matched normal human tongue tissue and TSCC specimens ( × 400 magnification). (C) Expression of TGFBR3 protein in specimens was evaluated by western blot analysis. (D) Expression of TGFBR3 mRNA in specimens was evaluated by RT-PCR. Glyceraldehyde 3-phosphate dehydrogenase (GAPDH) was used as loading control. These changes were quantitated using densitometry in (C). Data are expressed as the mean ± SEM from three independent experiments (n = 6). *p < 0.05 vs. control.
