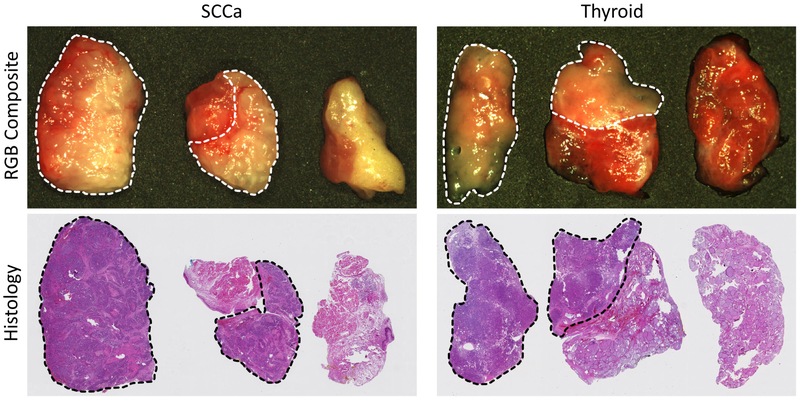
Figure 2:
Representative HSI-RGB composite and histological images from oral cavity with SCCa (left) and thyroid tissue with papillary thyroid carcinoma (right) patients. Three tissue samples are collected from each patient: tumor, tumor-normal cancer-margin, and normal. The dotted line indicates cancer margin on RGB and histology images.

