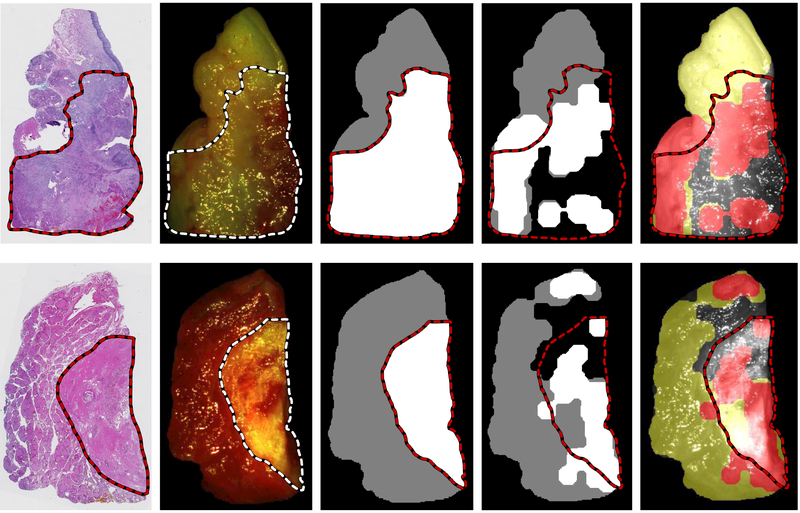
Figure 5:
Representative CNN classification results of non-glare regions of of oral cavity SCCa sample (top) and medullary thyroid carcinoma (bottom). From left to right: digitized histology slide, gross RGB composite of HSI with registered histological cancer-margin, binary ground truth image of tissue sample using registered histological cancer-margin (cancer is white, normal is grey), CNN classification result of tumor-normal tissue sample excluding regions with high glare pixel density (cancer is shown as white, normal is shown as grey), and artificial color visualization of CNN classification result overlaid on gray-scale HSI composite image (cancerous regions are shown in red and normal as yellow).

