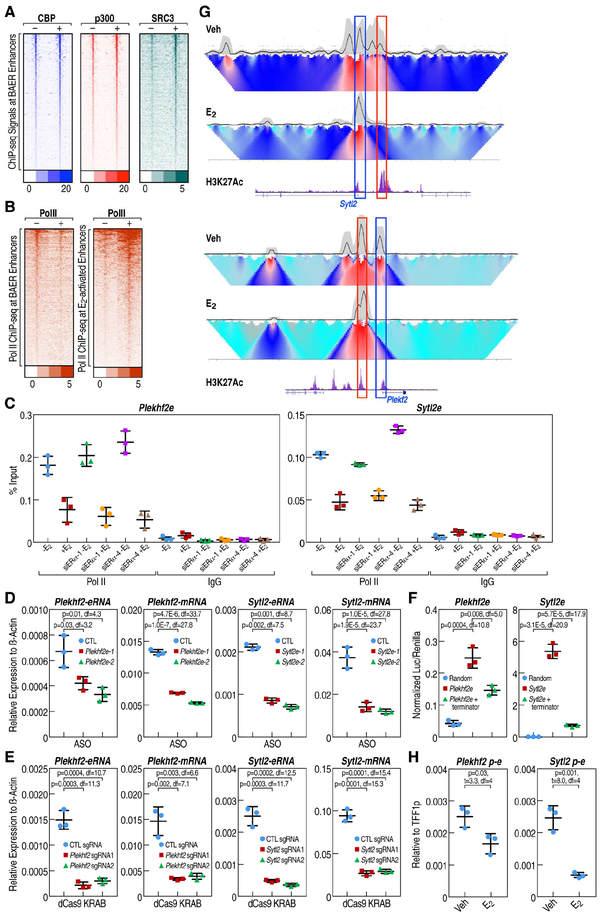
Figure 4. Indirectly-bound ERα recruits co-activators, but Pol II is dismissed from the enhancers upon E2 treatment.
A, The enrichment of CBP (E-TABM-785), p300 (E-TABM-785) and SRC3 (E-TABM-785) spanning ±3kb region from the center of BAER enhancer under Veh and E2 conditions, represented as heatmaps. B, The enrichment of Pol II spanning ±3kb region from the center of E2 active and BAER enhancer under Veh and E2 conditions were represented as heatmaps. C, The enrichment of Pol II at selected enhancers was measured by RT-qPCR when endogenous ERα was knocked-down using two different siRNAs targeting the 3’UTR of ERα in HA-tagged P-box mutant ERα stable cells. Data are presented as mean ± s.d. (N = 3; unpaired t test). D, Plekhf2 and Sytl2 eRNAs were knocked-down using two different ASOs. The expression level of Plekhf2 and Sytl2 mRNA and eRNAs are measured by RT-qPCR. Data are presented as mean ± s.d. P values denoting differences between between control sgRNA and sgRNAs target to Plekhf2- or Sytl2-enhancers. (N = 3; unpaired t test). E, Plekhf2 and Sytl2 enhancers were knockeddown by dCas9-KRAB with 2 different pairs of sgRNAs. The expression level of Plekhf2 and Sytl2 mRNA and eRNAs were measured by RT-qPCR. Data are presented as mean ± s.d. P values denoting differences between control sgRNA and sgRNAs target to Plekhf2- or Sytl2-enhancers. (N = 3; unpaired t test). F, Insertion of Pol II transcription terminators to Plekhf2 and Sytl2 enhancers could decrease downstream target reporter gene (luciferase) expression in HEK-293T cells. Plekhf2 and Sytl2 enhancers with ~500bp Pol II transcription terminators were cloned into pGL4.23 and transfected into HEK-293T cells, the luciferase value was detected by Dual-Luciferase® Reporter Assay System (Promega). G, 4C-seq under vehicle or 1hr E2 treatment in MCF7 cells is shown. The black line represents the interaction frequency based on liner mean in 200kb window. Gray cloud indicates 20th and 80th percentiles of confidence intervals of the main trend on the curve (black line). Domainogram (heatmap) represents the normalized contact profile, which resolution was ranked from 2kb on the top to 50kb on the bottom. Coordinate of enhancers are indicated with red box, while the promoters are indicated with blue box. H, 3CPCR assays showing the changes of the interaction between enhancer and promoter at Plekhf2 and Sytl2 loci upon vehicle or E2 treatment.

