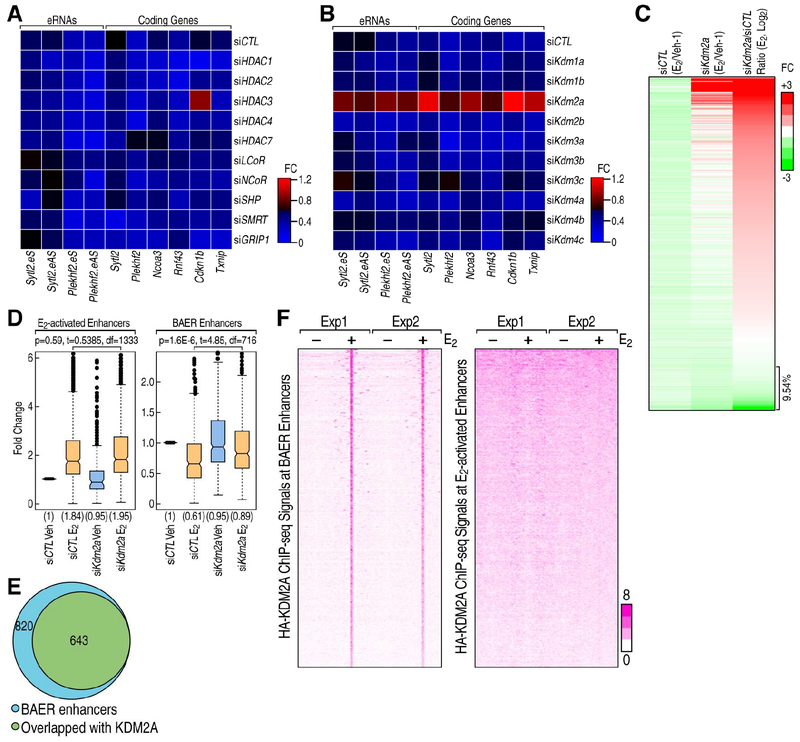
Figure 5. KDM2A is involved in ERα induced enhancer decommissioning.
A-B, RNAi screen showed that traditional corepressors (A) and histone demethylases (B) are less likely candidates, but that KDM2A is involved in the ERα mediated transcription repression in MCF7 cells. The ratios of the expression levels for the indicated eRNAs or coding genes between E2 and Veh conditions are showed by heatmaps. C, Heatmap showing that eRNA transcription level detected by PRO-seq was decreased by E2 in siCTL condition, and it is reversed by the knockdown of Kdm2a. The relative fold-change (E2/Veh-1) of each enhancer is shown. D, Boxand-whisker plots showing Pol II ChIP-seq signals (tag counts) in siCTL or Kdm2a knockdown MCF7 cells before and after E2 treatment (1 h) at E2 activated and BAER enhancers. P values denote statistical differences between treatment conditions. Centerlines show the medians, box limits indicate the 25th and 75th percentiles, and whiskers extend 1.5× the interquartile range from the 25th and 75th percentiles. E, Venn diagram showing the genome-wide overlap of ChIP-seq peaks of HA-tagged KDM2A with BAER enhancers in MCF7 cells upon E2 treatment. F, The enrichment of HA-tagged KDM2A spanning ±3kb region from the center of BAER and activated enhancer under Veh and E2 conditions, represented as heatmaps.

