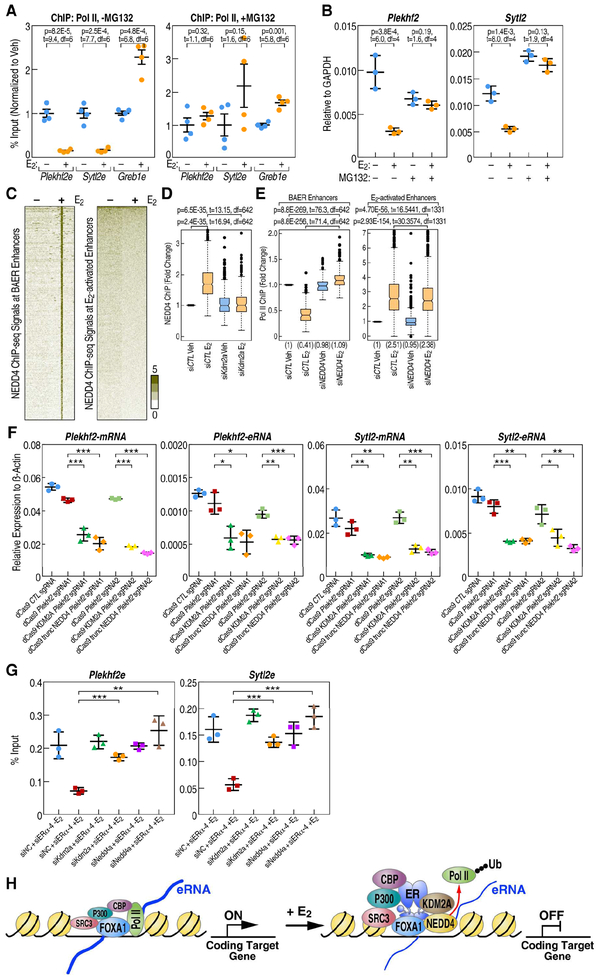
Figure 7. KDM2A recruits NEDD4 complex to dismiss Pol II at BAER enhancers.
A, E2-mediated decrease of Pol II at the Plekhf2 and Sytl2 enhancers is abolished by 10 M MG132 treatment for 3 h, as shown by Pol II ChIP-qPCR. ChIP signals are presented as percentage of input. Data are mean ± s.d. P values denoting differences between Veh and E2 condition are shown. B, RT-qPCR showing gene expression levels of E2 repressed gene-Sytl2 and Plekhf2 in response of E2 when MCF7 cells was treated with 10 M MG132. Data are presented as mean ± s.d. P values denote differences between +/− E2 treatment are shown (N = 3; unpaired t test). C, The enrichment of NEDD4 spanning ±3kb region from the center of BAER or activated enhancers in Veh and E2 conditions is represented as heatmaps. D, Box-and-whisker plots of NEDD4 ChIP-seq signals (tag counts) in siCTL or Kdm2a knockdown MCF7 cells before and after E2 treatment at BAER enhancers are shown. P values denote statistical differences between treatment conditions. E, Box-and-whisker plots of Pol II ChIP-seq signals (tag counts) in siCTL or Nedd4 knockdown MCF7 cells before and after E2 treatment at BAER enhancers, but not at E2 activated enhancers, are shown. P values denote statistical differences between treatment conditions. Centerlines show the medians, box limits indicate the 25th and 75th percentiles, and whiskers extend 1.5× the interquartile range from the 25th and 75th percentiles. F, Plekhf2 and Sytl2 enhancers were repressed by dCas9 fused with KDM2A or truncated NEDD4 (containing C terminal HECT domain) proteins generated using two different groups of sgRNAs. The expression level of Plekhf2 and Sytl2 mRNA and eRNAs are measured by RT-qPCR. Data are presented as mean ± s.d. P values denoting differences between control sgRNA and sgRNAs target to Plekhf2- or Sytl2-enhancers. (N = 3; unpaired t test; * = p< 0.05, ** = p< 0.01, *** =p< 0.001.). G, Endogenous ERα and Kdm2a or Nedd4 were knocked-down using siRNAs targeting in the ERα P-box mutated stable cell line. The enrichment of Pol II at selected enhancers was measured by RT-qPCR. Data are presented as mean ± s.d. (N = 3; unpaired t test; * = p< 0.05, ** = p< 0.01, *** =p< 0.001.). H, Working model: E2 treatment causing an increased enrichment of coactivators, such as P300, CBP, SRC3 at BAER enhancers. KDM2A interacts with the DBD of ERα, recruits NEDD4 to the enhancers, and dismisses Pol II to impede enhancer activation to eliminate target gene transcription.

