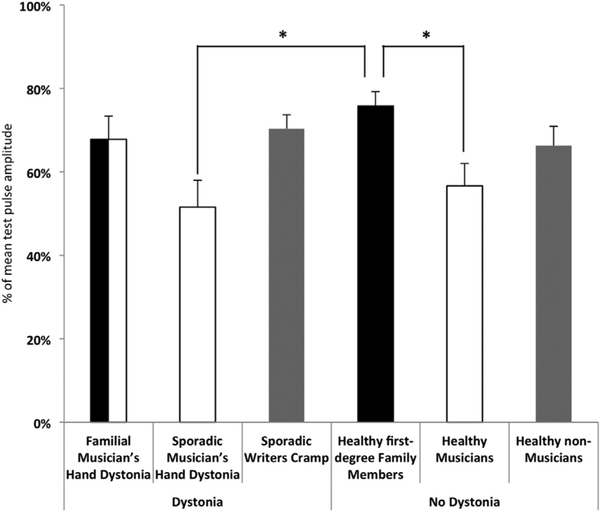
Fig. 1.
Group differences of interhemispheric inhibition (IHI). Mean IHI values for the different groups are given. The presence of the factor dystonia is symbolized by the sorting of columns with groups with dystonia on the right and those without on the left side of the figure. The factor family history of dystonia is symbolized by the colour black and the factor professional musician by the colour white. The grey columns indicate groups without any of these factors. Note that the group familial musician’s hand dystonia include both factors. The asterixis indicate a significant difference in the post hoc test (Bonferroni correction) between groups (p < 0.05).

