
Figure 3.
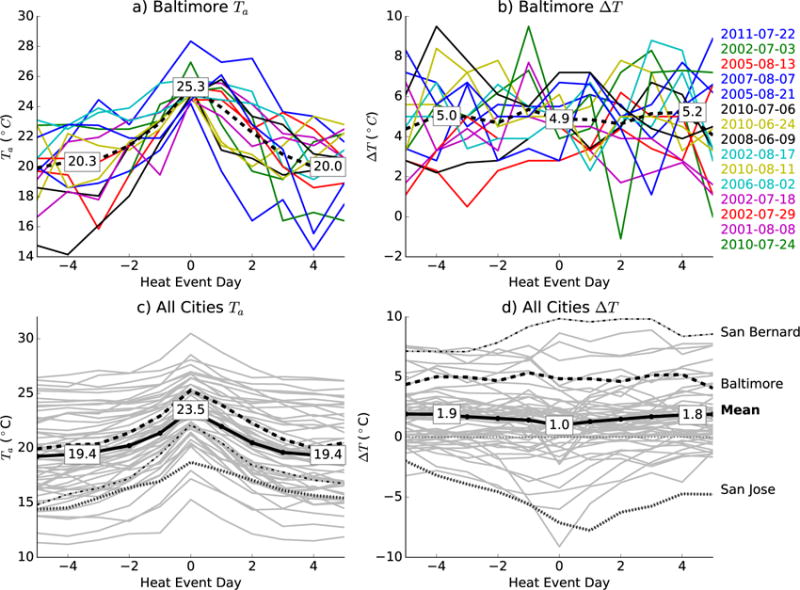
Heat events: a) temporal evolution of Ta for the 15 hottest nights for Baltimore (colors) and their mean (dashed black line), b) temporal evolution of ΔT for those events, c) temporal evolution of Ta averaged across the ten hottest events for each city and the sample mean (heavy black line), and (d) as in (c) but for ΔT.