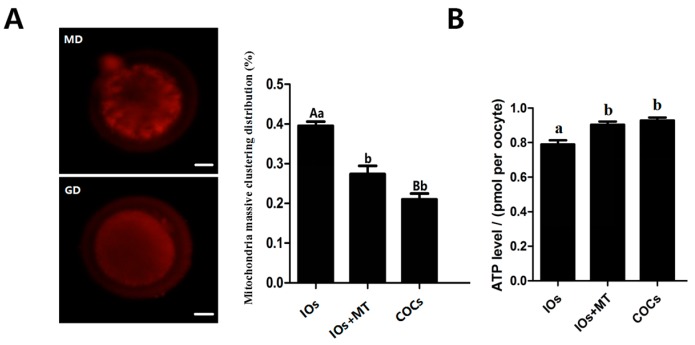
Figure 3.
Effects of melatonin on mitochondria distribution and ATP production in MII-stage oocytes. (A) The state of mitochondria distribution, (mean ± SEM of 87 oocytes). The red fluorescence represents mitochondria. MD: the representative image of mitochondrial massive clustering distribution. GD: the representative image of mitochondrial granulated distribution; scale bar = 20 μm; the bar graph was the statistical analysis of the mitochondrial distribution in oocytes; (B) Cytoplasmic ATP levels in individual MII bovine oocytes (mean ± SEM of 85 oocytes). a,b Values of different superscripts indicate significant difference (p < 0.05); A,B Values of different superscripts indicate highly significant difference (p < 0.01).

