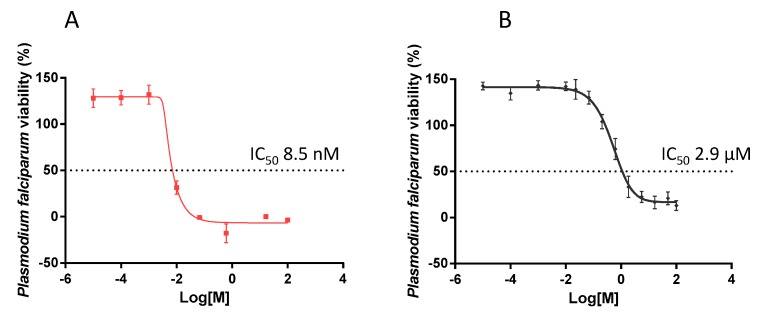
Figure 6.
Normalized dose response curve for the in vitro susceptibility of P. falciparum to EGCG. The in vitro antiplasmodial activity of EGCG was investigated using a pLDH ELISA assay. The assay was conducted on P. falciparum 3D7 cells maintained at the blood stages in the presence of EGCG. Chloroquine was used as a control (IC50 of 8.5 nM). The curves represent data obtained from assays conducted in the presence of choloroquine (A) or EGCG (B), respectively. IC50 values were calculated from the generated dose response curves obtained using GraphPad Prism 6. The experiment was performed in duplicate wells. Standard deviations obtained from three replicate assays are shown.

