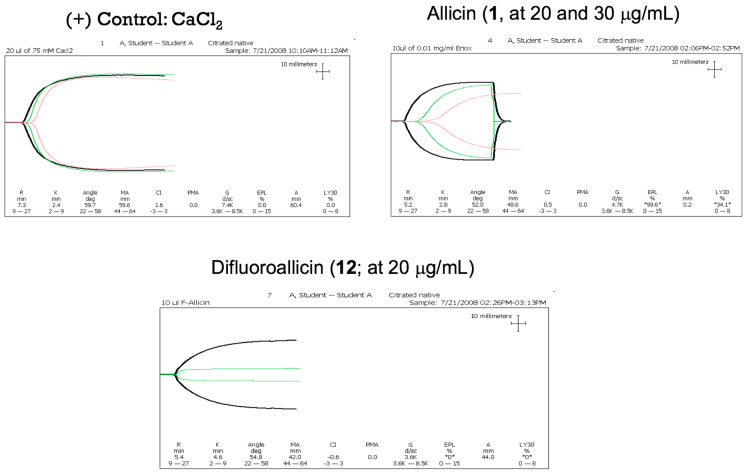
Figure 11.
Representative tracing of clot kinetic for control human blood and blood treated with either allicin (1) or difluoroalliicin 12 at 20–30 μg. The clot strength is measured by the width of the tracing at the end of tracing. For the positive control, there is a large width seen, which means that effective blood coagulation occurred. Difluoroallicin 12 showed distinct and greater inhibition at 20 μg/mL concentrations compared to allicin. This can be seen in the green trace relative to the control black tracing.

