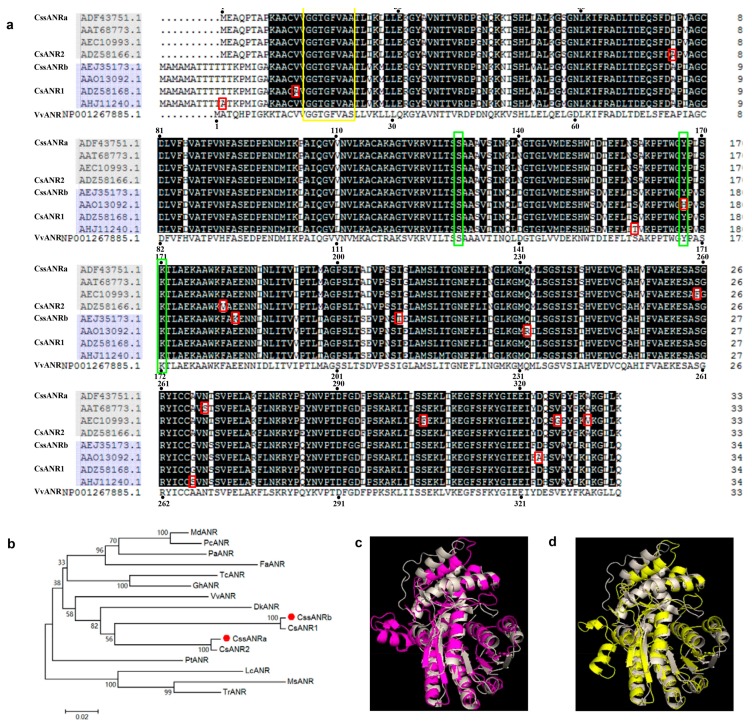
Figure 4.
Molecular characterization of two ANR homologs. (a) A sequence alignment shows both difference and identity of amino acids in nine homologs. Those different amino acids are highlighted using a small red rectangle. The yellow frame shows G-rich NADPH and NADH binding domain; (b) a phylogenetic tree established using 16 ANR homolog amino acid sequences; (c,d) Three dimensional structure prediction for CssANRa (c) and CssANRb (d) using grape ANR template (2rh8A), gray: 2rh8A, red: CssANRa and yellow: CssANRb.

